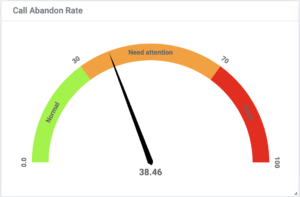
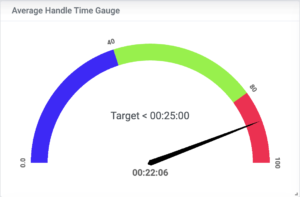
Call center performance comes down to a handful of measurable numbers. Average handle time tells you how long agents spend per call, including talk, hold, and after-call work. Call abandon rate tells you what percentage of callers hang up before reaching anyone — most teams aim to keep it under 5 percent. Each article in this section takes one of these KPIs and explains what it means, the formula behind it, what a reasonable target looks like, and which changes actually move the number.
These metrics matter because they describe the caller’s experience in terms you can act on. A rising abandon rate usually points to understaffed queues or a confusing IVR; a climbing handle time often signals training gaps or clumsy after-call processes. None of this requires surveys or guesswork. Every PBX already logs the raw material — call detail records with timestamps, durations, hold times, and outcomes. PBXDom reads those records from your existing phone system and computes these KPIs automatically, so the abandon rate or handle time you see on a dashboard reflects real calls, updated as they happen, rather than a manual spreadsheet built at the end of the month.
Going deeper
The explainers here are intentionally short — a starting point for anyone who needs a working definition and a formula. For longer treatments, the blog covers the same ground in more depth: see everything you should know about average handle time and what call center analytics is and how it works.