
Most call reports will tell you that you missed 212 calls last month. They won’t tell you whether that figure is a rounding error or a five-figure problem. The distinction decides how a budget meeting goes: “our abandonment rate is 8 percent” gets a shrug, while “we’re leaking about $11,000 a month at the front desk” gets a follow-up question.
This post walks through a formula for converting missed calls into dollars, shows you how to estimate each input from your own data without inflating it, and works the math for three kinds of reader. For background on what counts as an abandoned call and what a reasonable rate looks like, our earlier series on the optimal call abandonment range covers that ground.
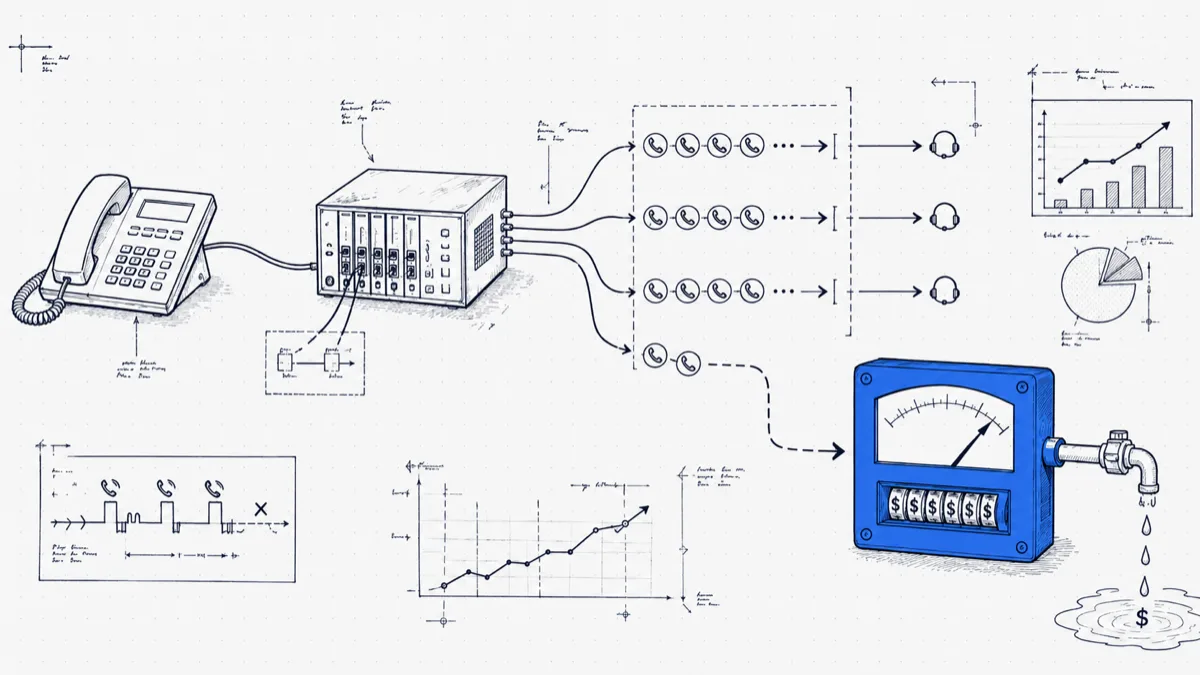
The formula
Missed calls per month × share that were sales or billable inquiries × average deal or ticket value × close rate = monthly leakage
The formula takes four inputs. You can pull or estimate each one from data you already have, and each one will tempt you to shade upward, because a scarier number feels more persuasive. Resist that. A $4,000-a-month figure you can defend line by line survives a CFO’s questions; an inflated $40,000 figure collapses under the first one and takes your credibility with it.
Input 1: missed calls per month
Take this input straight from your phone system’s call records, with three filters applied. Drop calls abandoned in under five seconds, a band dominated by misdials and robocallers. Drop internal calls, since an unanswered extension-to-extension call costs you no revenue. Then deduplicate by caller ID within the same day: a caller who rings three times and connects on the third attempt counts as zero lost opportunities, and a caller who rings three times without connecting counts as one.
Dedupe alone often cuts the raw count by 20 to 40 percent. The smaller, cleaner number is the one worth presenting.
Input 2: share that were sales or billable inquiries
You can’t know the intent of an unanswered call, so borrow the intent profile of the calls your team did answer. Sample 50 to 100 answered calls on the same trunk or queue, during the same hours your misses occur, and classify them: new business, existing customer, vendor, junk. Apply that ratio to the missed calls, shaded down a notch if anything, since junk callers give up fastest and are overrepresented among quick abandons.
Input 3: average deal or ticket value
Pull this from your CRM, practice management, or billing system, and use the median. One outsized contract can double a mean and wreck the credibility of everything downstream. If you want to argue lifetime value, do it as a footnote; keep the headline math on first-transaction value.
Input 4: close rate
Take your close rate on the inbound inquiries your team answers. If sales converts 25 percent of the inbound calls they take, there’s no reason the calls you missed would have closed at 60. Use the real number.
Worked example: a dental clinic
Two front-desk staff, single location. After filtering and dedupe: 95 missed callers a month, concentrated between noon and 1:30.
Sampling answered calls puts the new-patient and bookable-appointment share at 35 percent, or about 33 of those callers. Median first-visit value is $280, and the booking rate when a human answers is 60 percent.
95 × 0.35 × $280 × 0.60 ≈ $5,600 a month, and that figure stays conservative because it ignores everything a retained patient spends after the first visit. Against it, lunch-hour coverage from a part-timer at about $1,400 a month doesn’t need a slide deck.
Worked example: a B2B services firm
A managed-services provider whose misses cluster at lunch and after 4:30 p.m. After cleanup: 40 missed callers a month.
Only 15 percent represent new business, since most callers are existing clients. That leaves 6 callers. Median first-year contract value is $9,000, and the close rate on inbound leads is 20 percent.
40 × 0.15 × $9,000 × 0.20 = $10,800 a month. The base is thin, though: six callers. With numbers this small, present a range instead of a point estimate. Varying the close rate between 10 and 30 percent gives $5,400 to $16,200, and the range is more honest than either endpoint.
The 85 percent of missed callers who were existing clients carry churn risk of their own. Mention that in the writeup, but keep speculative churn dollars out of the headline figure.
Worked example: an internal IT help desk
No revenue here, so the cost is rework and SLA exposure. A missed call to a help desk comes back as an email ticket, a walk-up, or a second call, and email is the expensive channel: a five-minute phone conversation becomes a day of back-and-forth messages.
Say the desk misses 130 calls a month after dedupe, and about 80 percent retry through some channel. If each retry adds about 15 minutes of extra handling on the slower channel, at a loaded cost of $38 an hour that’s about $9.50 per missed call, or about $990 a month in pure rework.
Rework is the small number. SLA breaches are the big one: if priority incidents reach voicemail at 2 a.m., a single breach with a penalty clause can outweigh a year of rework costs. Track breaches traceable to an unanswered call as their own line item, with incident numbers attached.
“They’ll leave a voicemail”
Most won’t. Most studies put the share of business callers who leave a message somewhere below one in five; the rest hang up and either try again later or call the next name on their list. The minority who do leave messages convert worse than live answers, because the callback arrives on your schedule instead of theirs. For the math, treat voicemail hits as missed calls, and credit back only the messages that got a same-day callback and connected.
Putting the number to work
The point of the dollar figure is to price a fix against it. Staggered lunch breaks cost nothing. An overflow ring group to the back office is a configuration change. Two hours of part-time midday coverage, or an after-hours answering service, have known monthly prices you can set against the leakage.
Two rules keep this credible. Don’t promise the fix recovers 100 percent of the leakage; 50 to 70 percent is the defensible assumption. Then re-run the same measurement 30 days after the change with the same filters, using live call monitoring or your raw CDR data, and report the delta whichever way it went.
Where PBXDom fits
The math above starts with one dataset: a clean, deduplicated record of who called, when, and whether anyone answered. PBXDom builds that dataset from your PBX’s own call records, with missed-call counts by hour and queue, caller-retry matching, and the time-of-day patterns that locate the coverage gap. If you’d rather not assemble it by hand from raw CDR files, the 14-day trial takes about 15 minutes to set up.