
We are very excited to introduce our new brand widget, “User Performance.” We are always actively listening to our customers to identify their needs and figure out how to meet them.
One of the needs that came up on our list this month was the “User Performance” widget.
Many of our users asked for a widget for each user/extension/agent status or overall performance in one place instead of using several different widgets.
So, here we go. We released the “User Performance” widget on October 20; you can find this widget in the General category.
Before we continue, I want to explain all the calculations behind this widget and help you see how it would be nearly impossible to calculate manually or with legacy software.
Based on working hours and extension numbers, it automatically calculates all incoming calls in a day. Next, it calculates all incoming calls from the previous day. It compares the numbers from both days and shows all the numbers and percentages. The same process is repeated for outgoing calls, missed calls, and total calls. It automatically sums up all talk time (call durations) for all the calls users made/received during the day and then shows the total talk time. Finally, it calculates the last call the user made/received, and the real-time timer shows the idle time since the previous call.
These calculations will help you to understand each user’s performance. If they are sales reps or support specialists, this is another metric to help understand their efforts.
Now, to explain this widget. When you want to add the “User Performance” to your dashboard, you have to enter the following information:
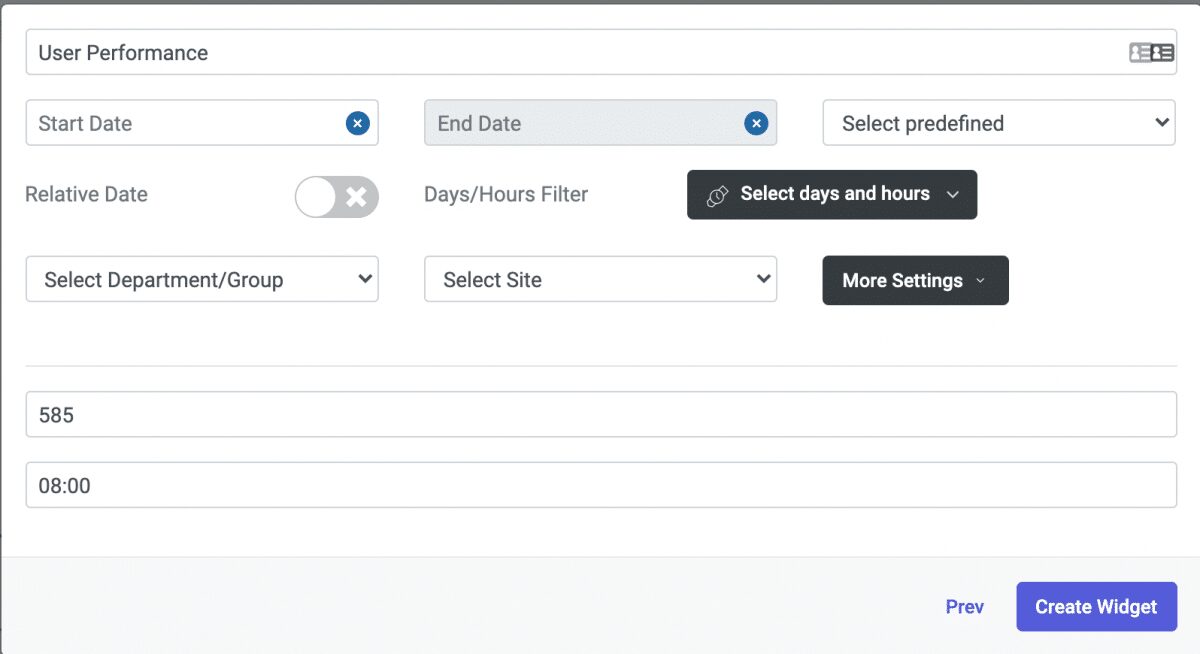
1-User extension number: You want to see the extension number’s performance. I entered 585 as the extension number on the picture above.
2-Working hours: This widget will compare the total talk time with the total working hours per day, so you have to enter the total working hours per day. Here, I entered 08:00, as seen in the image above.
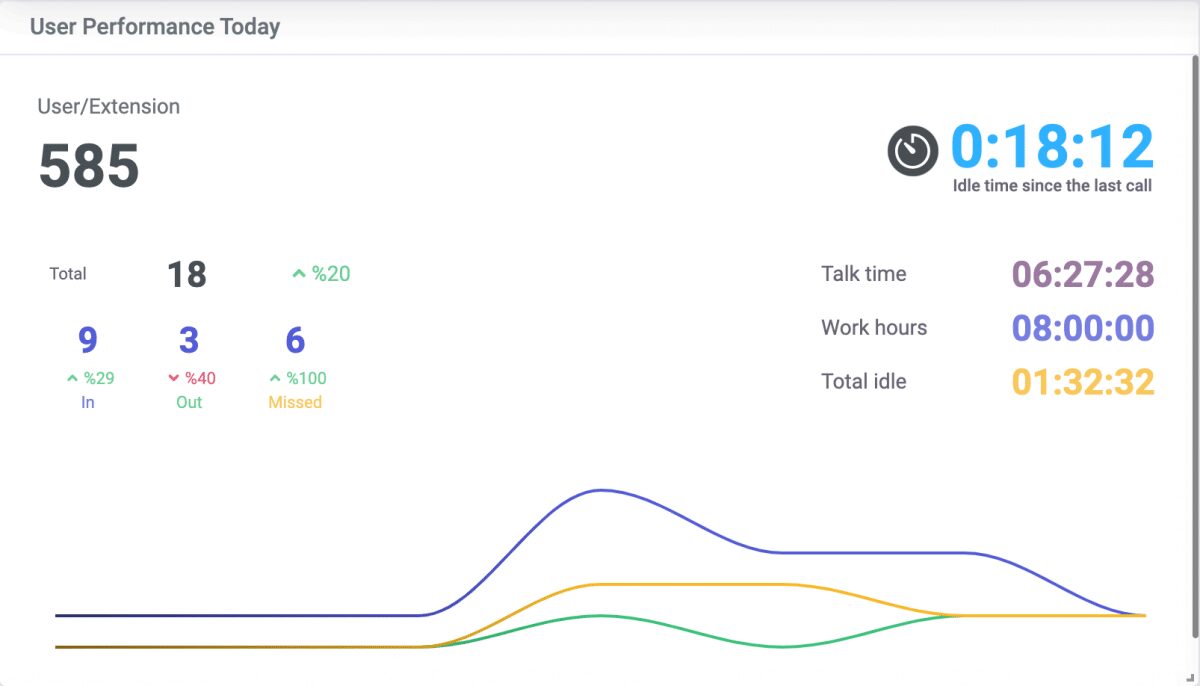
After adding the widget to the dashboard by clicking on the “Create widget” button, we can see the beautiful “User Performance” widget on our current dashboard.
Let me explain the information that appears on this widget.
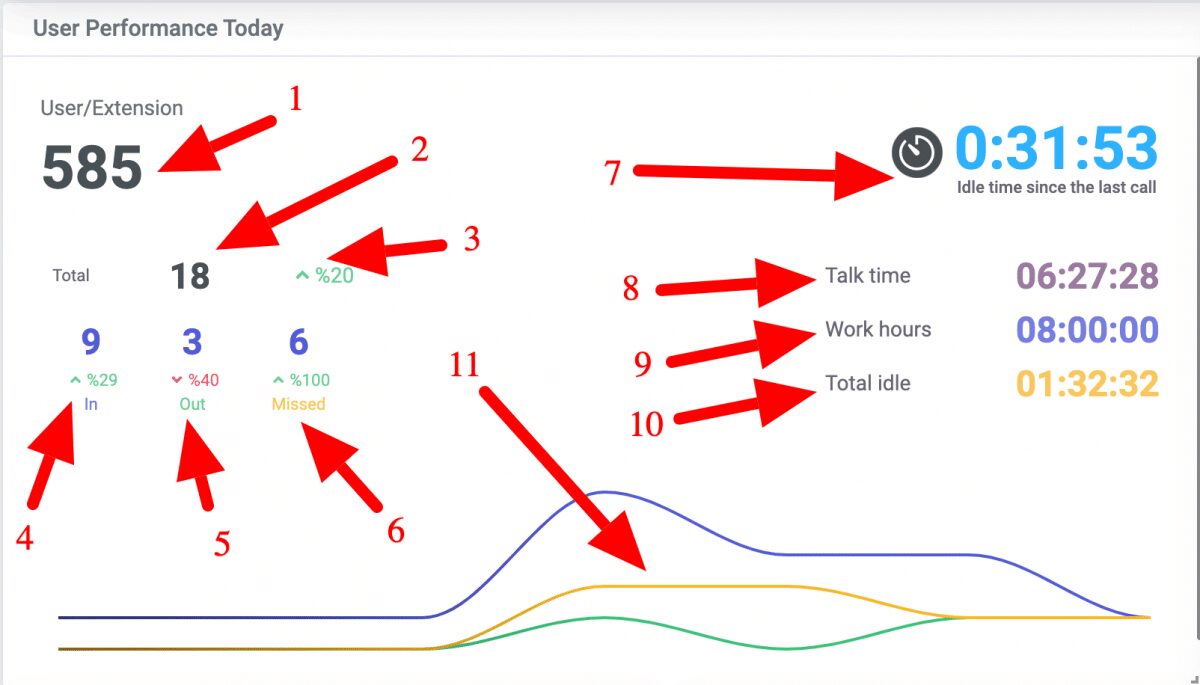
1-User/Extension number: You entered this while adding the widget earlier.
2-Total calls for this extension (Incoming + Outgoing + Missed). In our example, we had 18 calls.
3-Comparision with the previous day: (If you selected a specific date, you can’t use this widget with date range). You can see two things here: a small up/down arrow, which means current numbers are higher or lower than the previous day’s, and a percentage which means the comparison between the present day and the previous day. In the example above, our total calls were higher than the previous day’s because we see an arrow pointing up. It was 20% more than the previous day’s.
4-Total incoming call and comparison with the previous day.
5-Total outgoing call and comparison with the previous day.
6-Total missed call and comparison with the previous day.
7- Total Idle: This shows the real-time since the last call(incoming/outgoing) this user made. For the above example, the last call was 31:53 (31 minutes and 53 seconds) ago, which means this user has been idle during the last 31 minutes.
8-Talk time shows the total call duration for all incoming and outgoing calls this user made. For the above example, it was 6 hours and 27 minutes, and 28 seconds.
9-Work hours show total work hours per day you entered while adding the widget earlier.
10-Total idle shows the difference between work hours and talk time. In the above example, it was 1 hour and 32 minutes and 32 seconds.
11- A graph showing incoming/outgoing/missed calls for this user.
We always actively listen to your valuable suggestions and requests. Please use the “User performance” widget and tell us what you think so we can keep offering you the best experience.