 PBXDom
Which calls went unanswered?
Review caller numbers, extensions, and time before hang-up where your PBX provides them.
Abandoned Calls reportPBXDom / Analytics & monitoring
Understand call volumes, missed calls, and extension activity—with dashboards and reports built from your PBX records.
14-day trial · No credit card required
01 / Call traffic
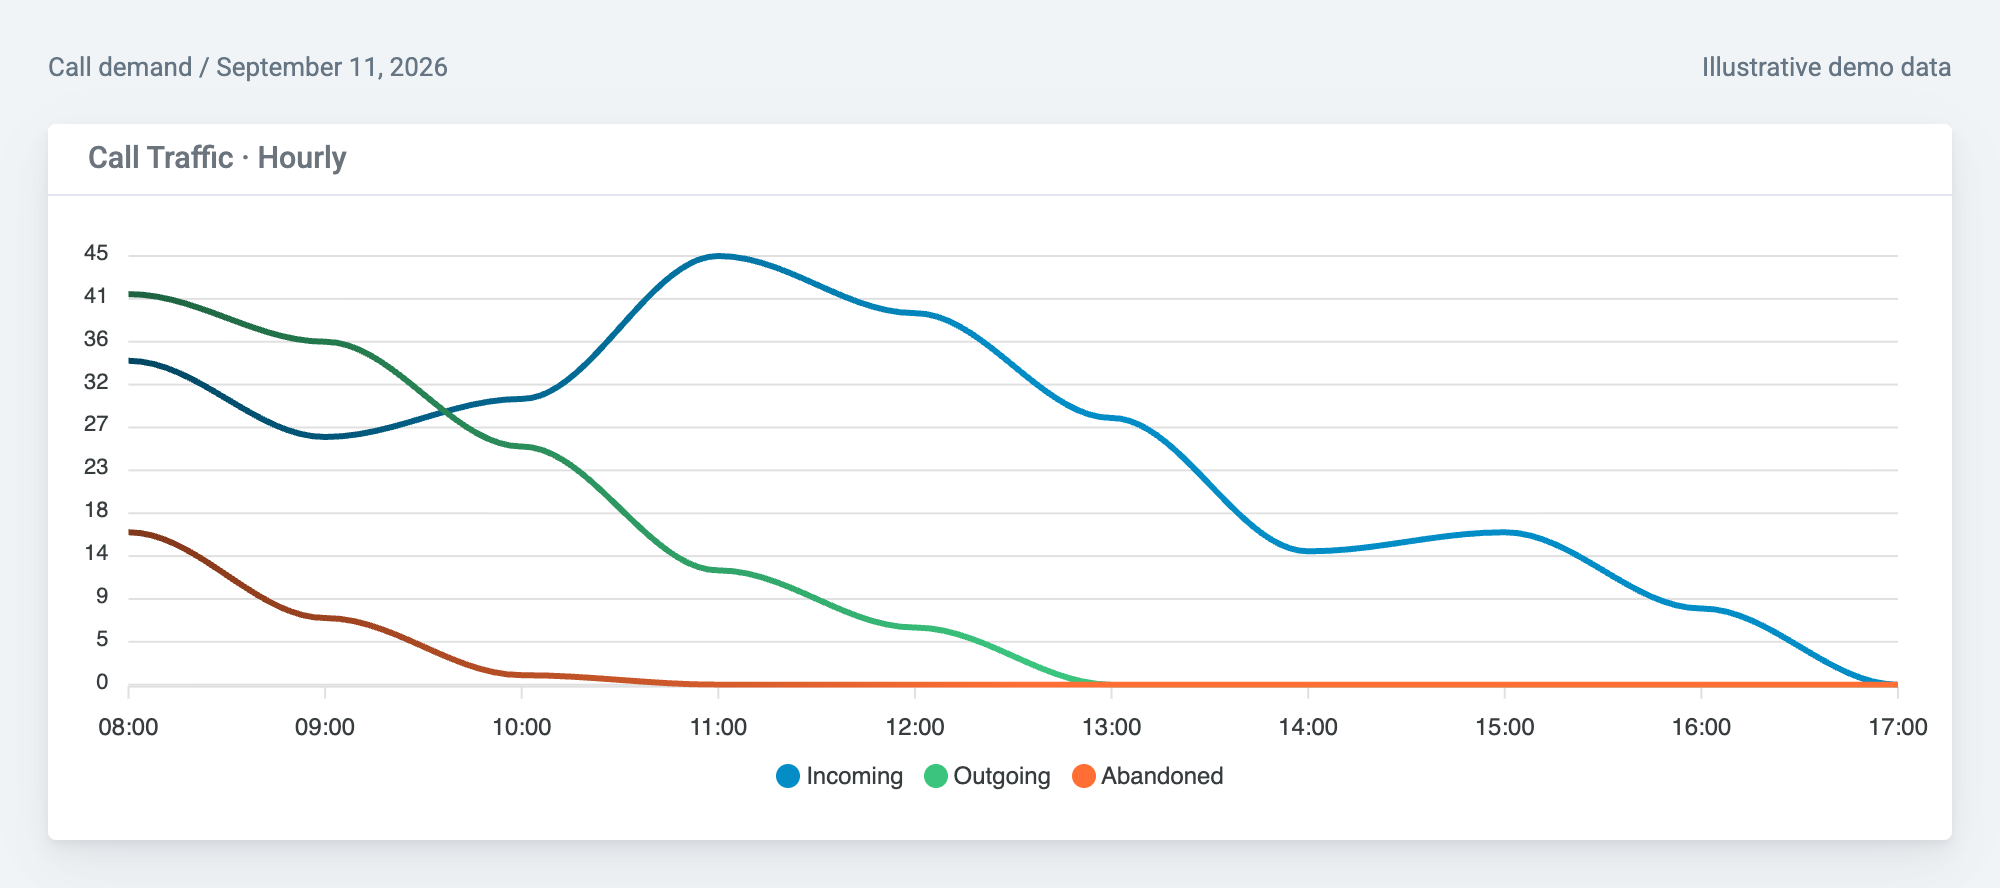
See incoming, outgoing, and abandoned calls together. In this example, 16 of the day's 24 abandoned calls fall in the 08:00 hour—a focused starting point for reviewing coverage.
70+ widgetsChoose metrics for your team
CSV, Excel & PDFTake reports into your workflow
Model-specific setupConfirm your PBX and data source
02 / Extension activity
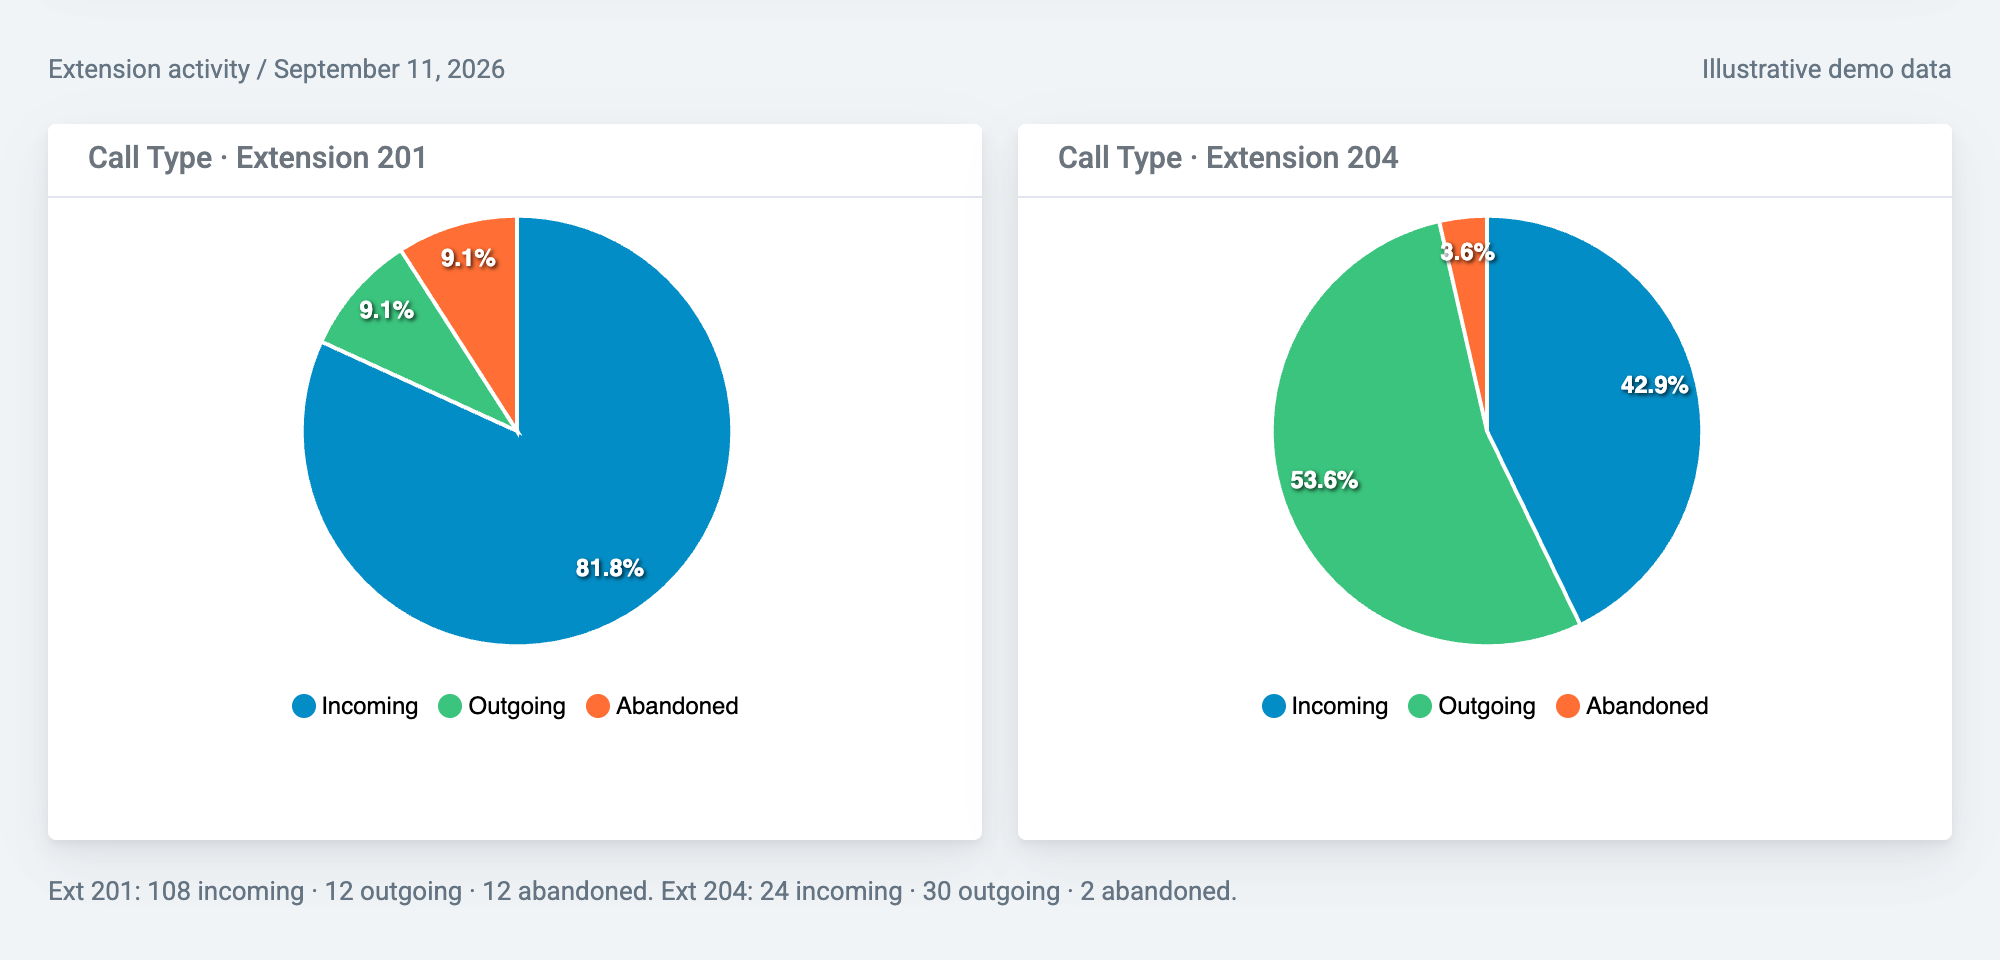
Reception's calls are mostly incoming. Extension 204 has a larger outgoing share. Compare each extension's mix before deciding which records to explore—not to rank employee productivity.
03 / Missed calls
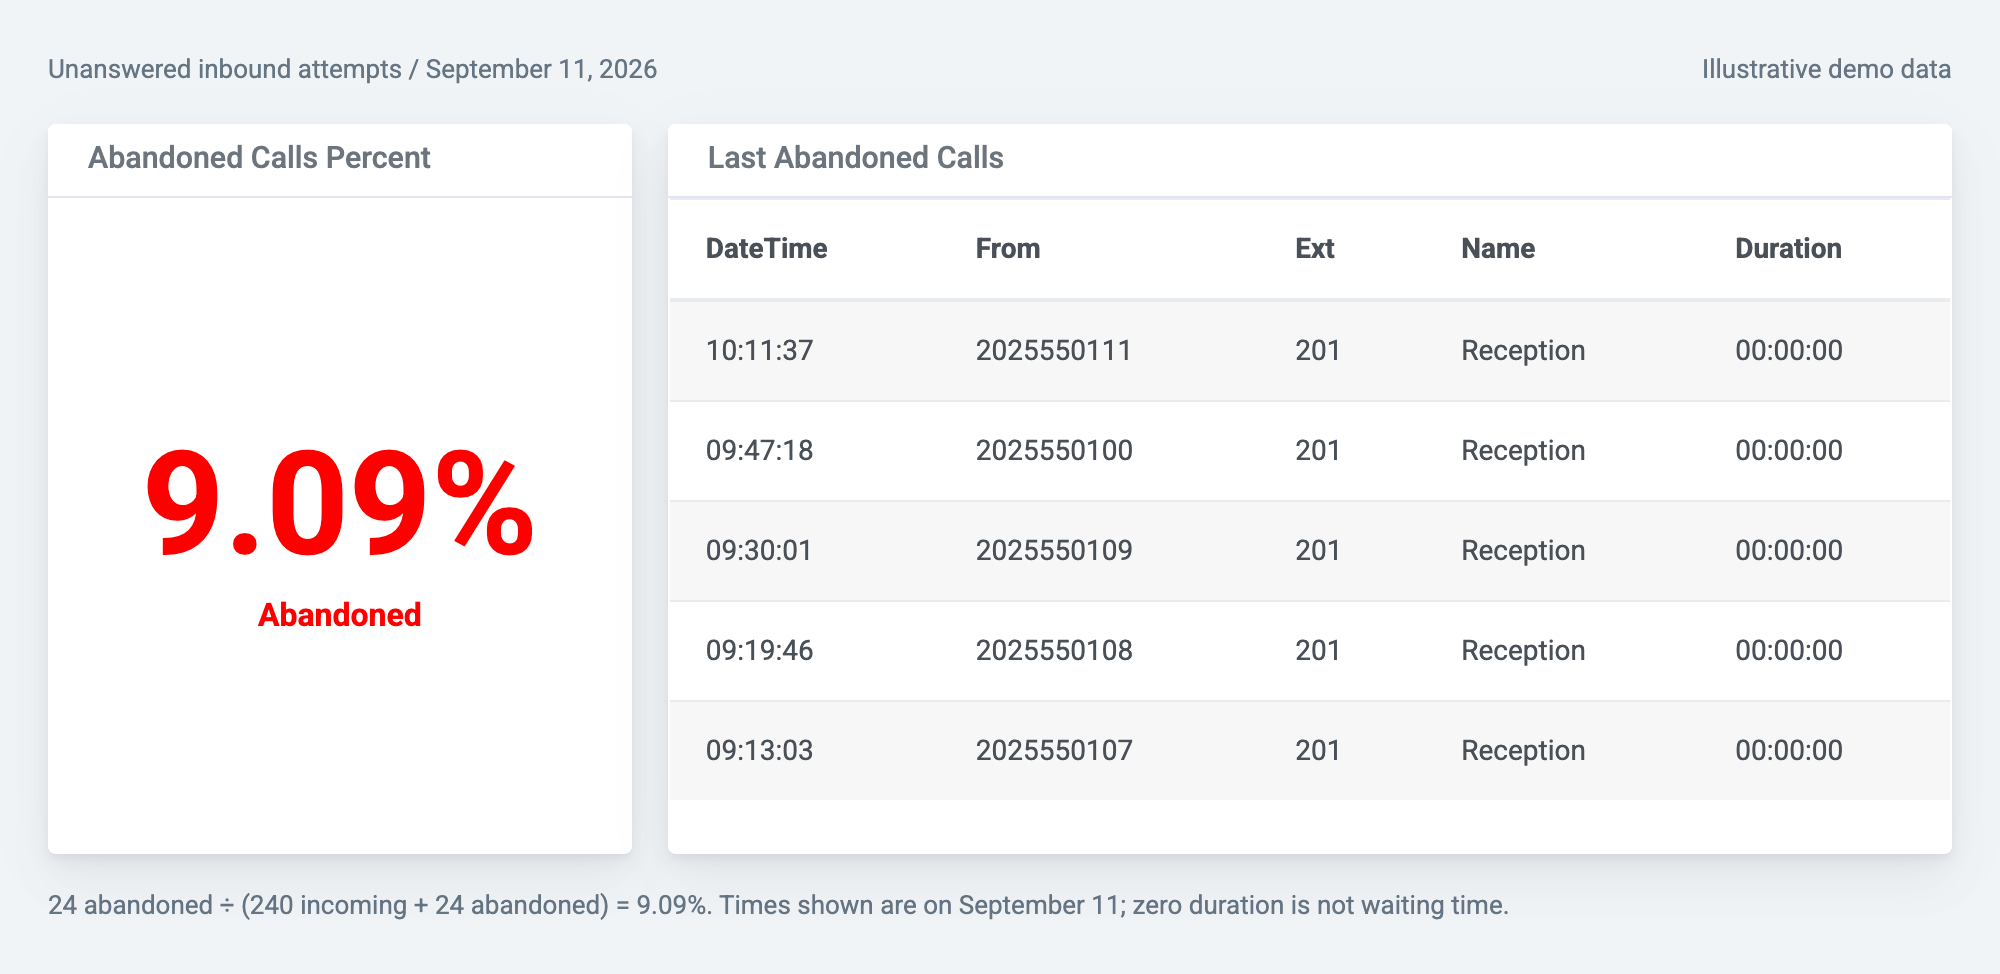
Pair the abandoned-call metric with recent records to find a caller, time, and extension worth investigating. Here, the latest unanswered attempt reached Reception at 10:11:37.
From question to evidence
Published report samples, open to explore.
Fields and update timing depend on your PBX output, collection method, and configuration.
Review caller numbers, extensions, and time before hang-up where your PBX provides them.
Abandoned Calls reportSee incoming and outgoing call totals and duration for a selected period. Activity is not a complete measure of productivity or availability.
Extensions Summary reportRank trunks by call volume—not remaining capacity. Use separate concurrent-call charts to review overlapping activity before changing capacity.
Top 25 Trunks reportNeed estimated costs and department allocation? Explore call accounting →
A telecom team's perspective
“I didn't have to export and import CDR reports from CUCM anymore. I could see the graphical data flowing in PBXDom dashboards.”
Venkata Pruthvi
Sr. Telecom Administrator
Fender Musical Instruments
Before you connect
CDR and SMDR reporting uses records delivered by your PBX. Live extension, line, and queue status requires a real-time protocol supported by both your PBX and PBXDom.
Dashboard & live-status guideRecord-based dashboards update as records are delivered and processed. They do not by themselves establish that a call is currently ringing or active. Confirm model-specific real-time protocol support before planning a live wallboard. Missed-call classification and waiting-time fields also depend on your PBX data.
Confirm your PBX model, software version, record output, collector host, and network requirements. Choose widgets supported by your system and plan.
Review security and data flow →Export reports as CSV, Excel, or PDF. Dashboard sharing and departments/groups are available on Pro and up. Decide which call information is appropriate for each audience.
Report filters and exports →Retention ranges from 1 to 5+ years by plan. Connecting a PBX does not automatically supply past records. Dashboard counts and phone-system limits also vary by plan.
Compare plans →Your first dashboard
Check compatibility, then choose guided setup or connect it yourself.
14-day trial · No credit card required
Bring your PBX model and version. Ask about real-time support if you need active-call or queue status.
Validate direction, extension, duration, time zone, and unanswered-call classification.
Choose a question, widget, and report. Match their date ranges and review the result with your team.