On PBXDom you can create several numbers of dashboard for different purposes such as organizing and presenting information using different available widgets.
PBXDom dashboard interface is very easy to understand and use. On PBXDom, a user can create as many as 50 dashboards. Each dashboard can be populated with up to 12 similar or different widgets displaying information.
Example: assume that the company or organization for which PBXDom is operating, has several branches, departments, and even divisions. You can create multiple number of dashboards for displaying different types of information, or any other possible purposes.

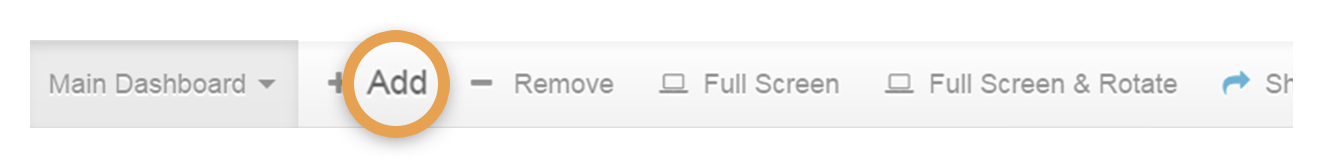
In order to create a dashboard, move your cursor on the horizontal bar, and then click on the Add button.
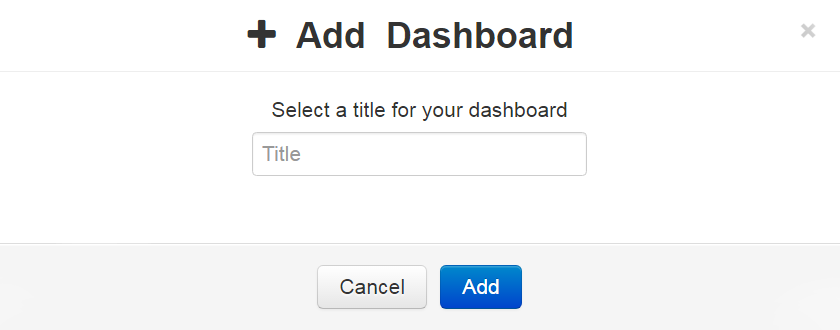
A pop-up dialog appears on the screen, asking for a name. In the opened window, enter your dashboard name and click the Add button. You can also cancel out by simply clicking on the Cancel button.
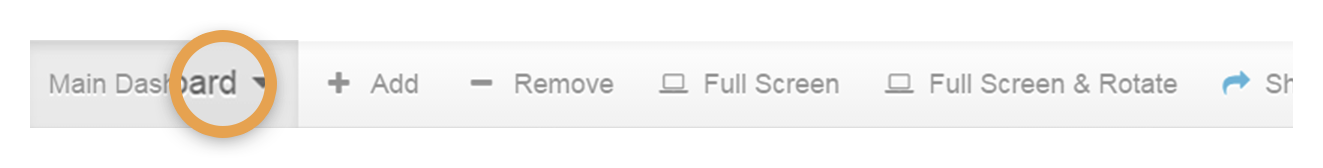
All created dashboards are listed under the Main Dashboard menu list. To view the list, the user needs to click on the Main Dashboard button.
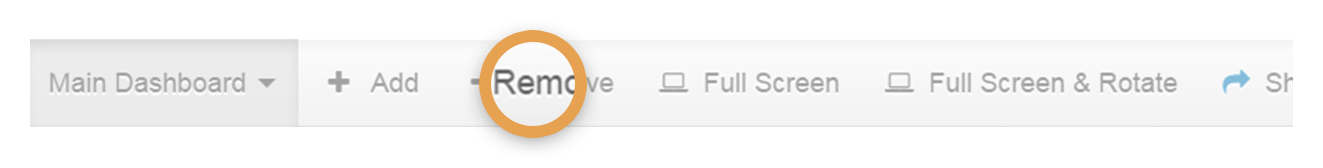
You can also remove the existing dashboards on the Main Dashboard menu list by clicking on the Remove button. Just keep in mind that the current dashboard always gets removed.
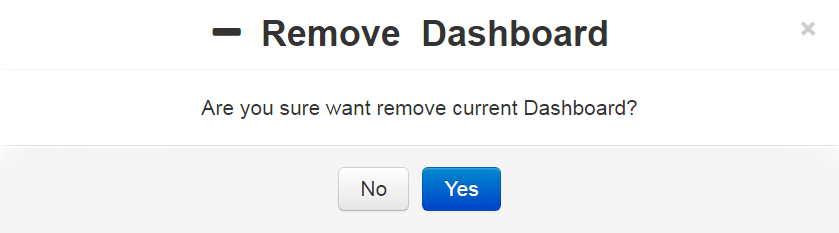
After clicking on Remove button, a pop-up dialog box shows up, asking you if you are sure to remove the current dashboard. You can either click on Yes or No button.
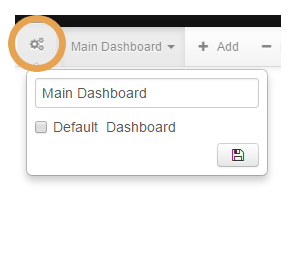
In order to rename one of your existing dashboards, or set your default dashboard, click on the Configure Dashboard button. After brining the changes, you can click on the save icon on the lower-bottom of the pop-up window.
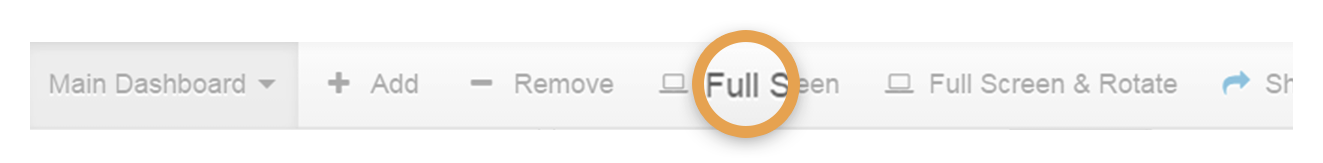
While viewing a specific dashboard, we can switch between different display modes. We can go to the full screen mode by clicking on Full Screen button.
And if interested, we can toggle from Standard mode to Full Screen, as well as having the possibility of sliding through several existing dashboards by clicking on the Full Screen and Rotate button.
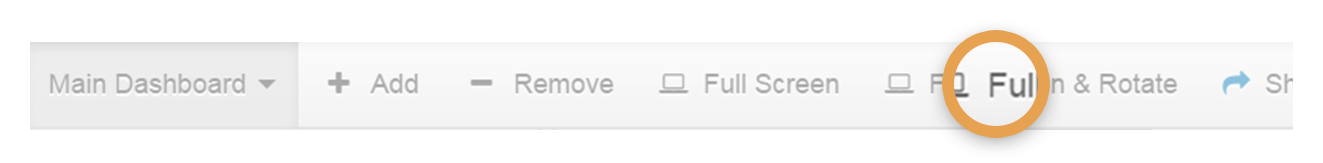
To toggle back to the standard mode, we can press the ESC key on the keyboard.
You can use the Share button to generate a Google shortened URL link, which gives you the possibility of sharing a read-only display of the current dashboard with several individuals and groups through internet. These individuals can be within your company or not. However, sharing a specific dashboard does not give the other viewers the control possibilities.
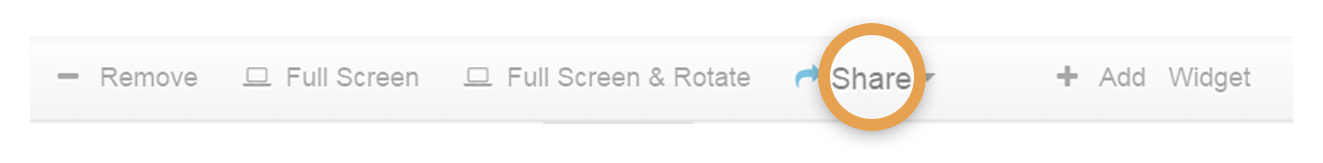
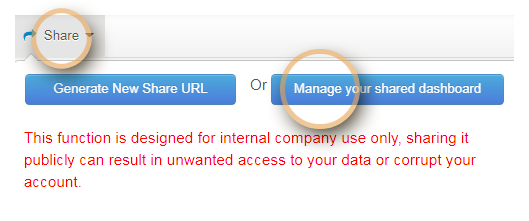
To create a link, click on the Share button on the horizontal bar. A window appears with two blue buttons. Click on Generate New Share URL button. Then an input window shows up.
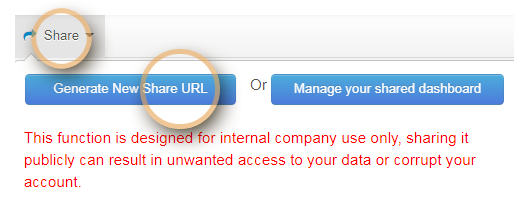
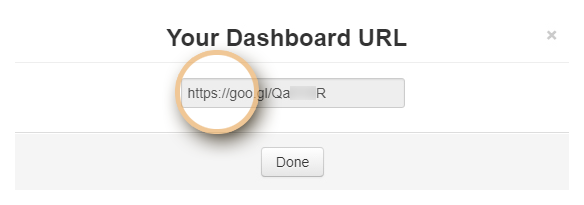
Select, copy and share the generated Google shortened URL link with other individuals or groups. Press the Done button at the end.
Note: this function is only designed for uses within the company. Sharing it publicly can result in security risk.
To view the list of the all the generated URL links and becoming able to manage them for all your account’s created dashboards, click on the Share button at the top of buttons bar, and then select Manage your shared dashboard button by clicking on it.
Then the application navigates its way to the Account settings section and the following table shows on the screen with the name of Shared Dashboard.
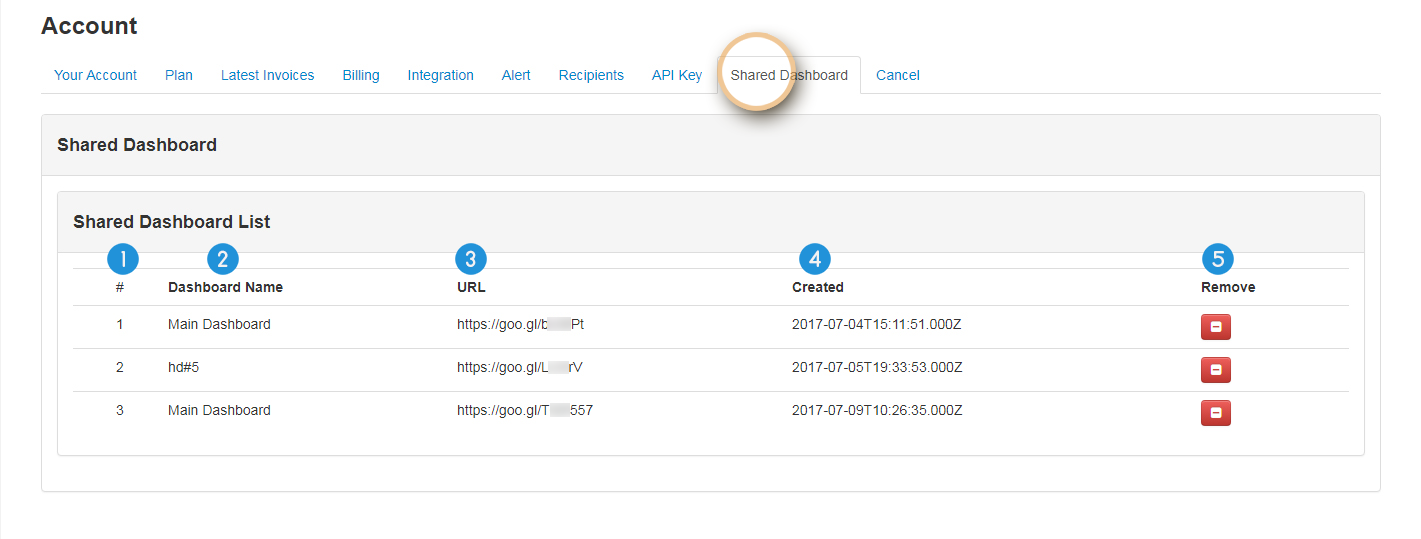
1. Number: number of the URL in the list
2. Dashboard Name: name of the dashboard
3. URL: Google shortened URL link for sharing read-only version of dashboards with others
4. Created: the date and time the URL link was created
5. Remove: remove icon for deleting the URL link forever
Under the Shared Dashboard list, you are given the power to break the links, by simply clicking on the Remove icon.
Note: if a user removes a URL link from the list of the Shared Dashboards, then nobody could view the dashboard using that link. It is a very useful and helpful way of sharing a dashboard for some period of time and then then breaking the links. After deletion of a URL link, it will not work.
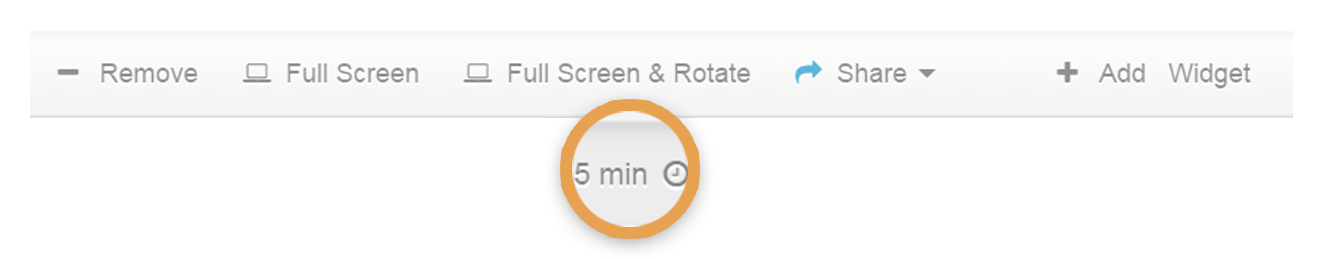
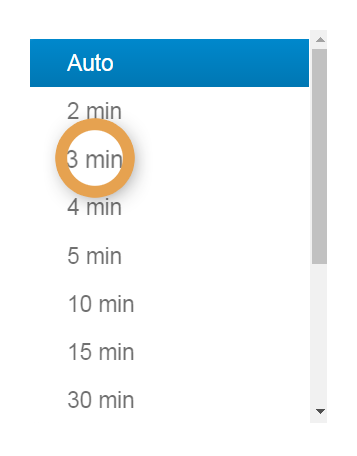
We can set a Refresh time for each dashboard separately by clicking the clock icon on the horizontal bar, and select from a list of available times. By default, it is set to Auto.
You can select a predefined refresh time from the list.
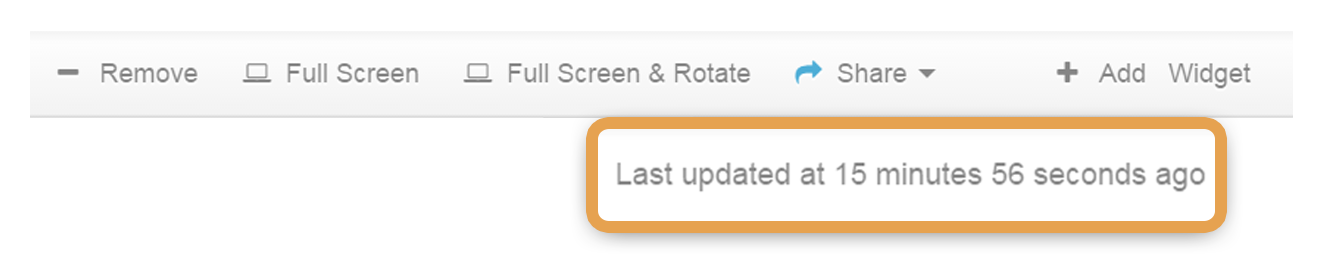
Last Update Time shows us when the current dashboard was updated automatically. The user can refresh the page at any time by refreshing the page, or just press CTRL+R on the keyboard.
to show information in a dashboard, we can use different widgets for different needs. Each dashboard can be filled with up to 12 widgets for different purposes. PBXdom comes along with 60 different useful widgets.
A widget can be as simple as a single number, or as complicated as an analytical graph widget, which could give the user a more insight understanding of some specific data.
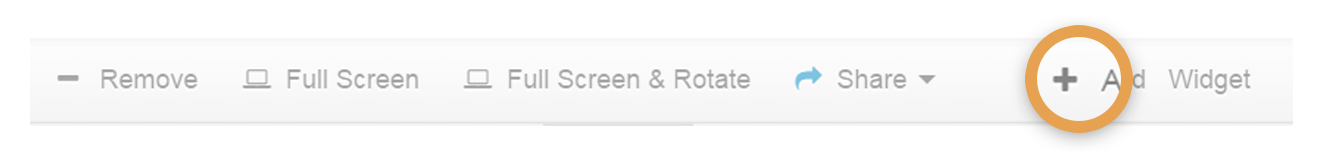
In order to add a widget to a dashboard, click on the Add Widget button on the horizontal bar.
Then a window appears on the screen, in which you can enter and define some information which is explained as follows:
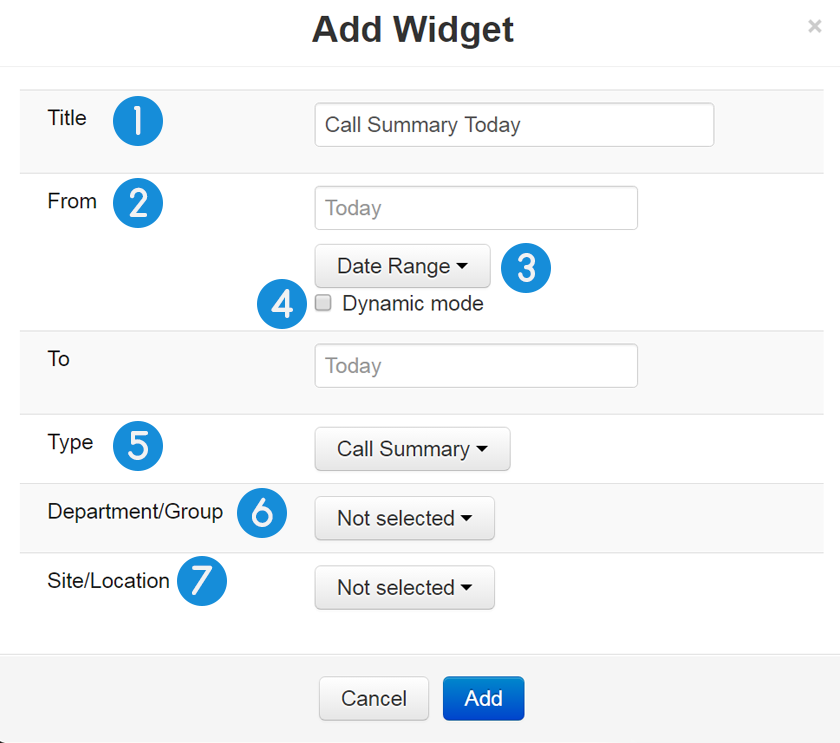
1. Title: you may like to enter a title for the selected widget. Otherwise, it will be set to the default title.
2. From/To: user can limit the information displayed by a widget to range of time. All it takes is clicking on the fields to the right of the From and To, and specify the range.
3. Date Range: a list of predefined time ranges. For example, we can limit the information being displayed by a widget on a dashboard to Today, Yesterday, or any other range.
4. Dynamic Mode: another great useful input while adding a new widget to a dashboard is Dynamic Mode. By checking Dynamic Mode checkbox, the specified range of time of the widget dynamically changes as the current date changes.
5. Type: here the user can define the type of the widget from a list of 60 available ones.
6. Department/Group: here, you can define the exact department or group within your company or organization from which you like your widgets to be limited to regarding information they are showing.
Example: you may have a sales department, or graphic design in your company, and you might be only interested in limiting your widgets to show you information from a specific department.
7. Site/Location: users can connect many PBXes to their account on PBXDom site and receive information from different locations. A widget can be limited to show information from a specific PBX or location.
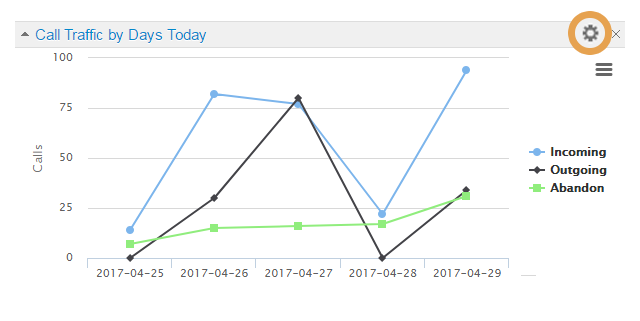
to reconfigure any widgets, we can use the gear icon in the top-right corner of all the widgets. Then a pop-up dialog window reappears.
PBXDom has a series of widgets for a variety of purposes, ranging from simple ones to more detailed ones for more advanced uses. We have several categories of Summary, Incoming, Outgoing, Abandoned, Duration, Cost, etc.
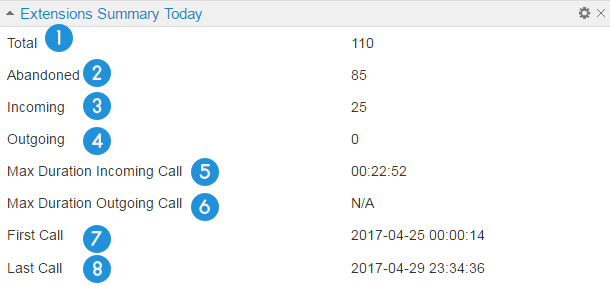
This widget shows a summary report of all the Incoming, Outgoing, Abandoned calls of a certain department or branch, and even all.
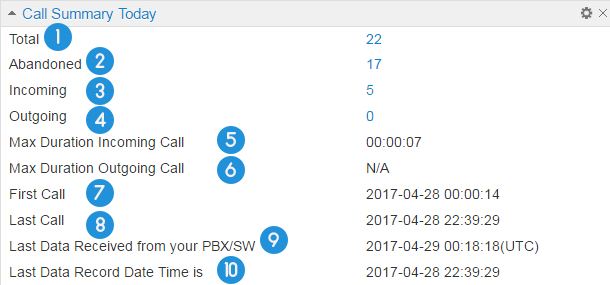
1. Total: all the Incoming and Outgoing calls
2. Abandoned: all the missed calls
3. Incoming: all the calls received
4. Outgoing: all the calls made
5. Max Duration Incoming Call: shows the longest duration among the Incoming calls
6. Max Duration Outgoing Call: shows the longest duration of the Outgoing calls
7. First Call: the exact time and date the first call was made
8. Last Call: the exact time and date the last call was made
9. Last Data Received from PBX/SW: last time and date, the data was retrieved from PBX/SW and displayed on the current dashboard
10. Last Data Record Date Time is: last time and date information was recorded on the PBX
Call Type widget is a way of displaying the total number of Incoming, Outgoing, and Abandoned calls in percentage through a pie chart. This chart has only three slices.
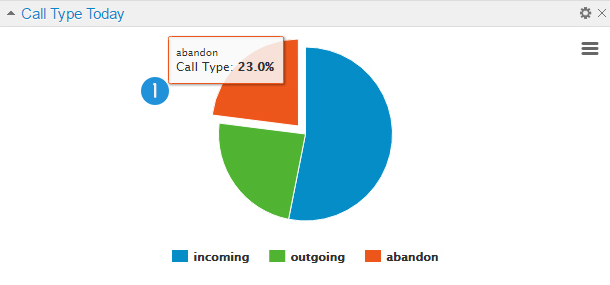
1. By hovering your cursor on each of the slices, a hint appears.
This widget provides a list of the last Incoming calls. It has four columns of DateTime, From, Ext, Duration.
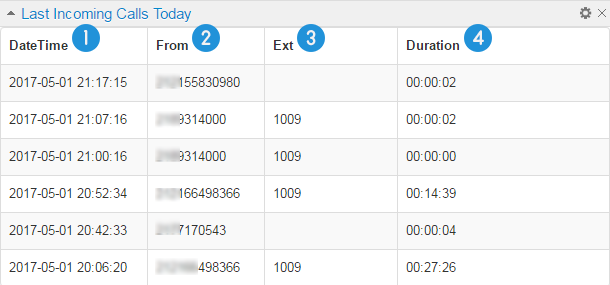
1. DateTime: the exact date and time the call was received
2. From: the phone number of the caller
3. Ext: the extension number which answered the call
4. Duration: shows the duration of a call
This widget provides a table to present the last Outgoing calls. It has four columns of DateTime, To, Ext, Duration.
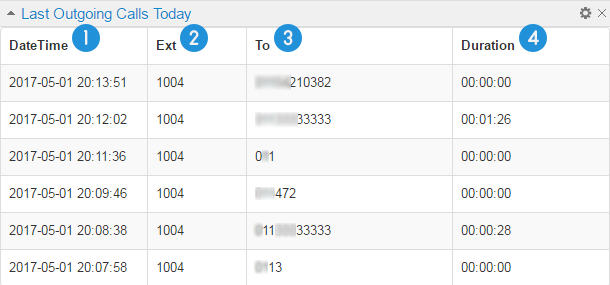
1. DateTime: the exact date and time the call was made
2. Ext: the extension number from which the call was made
3. To: the phone number to which the call was made
4. Duration: shows the duration of a call
This widget shows the number of Incoming, Outgoing, and Abandoned calls on hourly-basis using three continual linear graphs with colors blue, black, and green. Call Traffic widget has two Horizontal and Vertical axes.
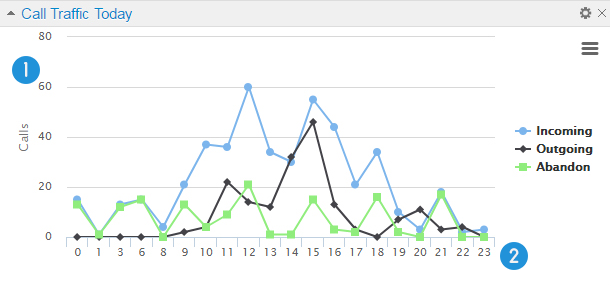
1. Vertical axis: number of the calls at a specific time can be defined on the vertical axis.
2. Horizontal axis: hours are scattered across the horizontal axis
Trunk Utilization shows the total number of Incoming, Outgoing, and Abandoned calls of each land lines using a bar chart. This widget consists of two vertical and horizontal axes.
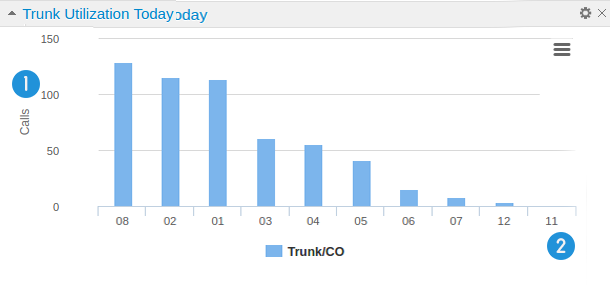
1. Vertical axis: the vertical axis shows the total number of Incoming, Outgoing, and Abandoned calls of each line using a vertical bar.
2. Horizontal axis: the horizontal axis shows each of the land lines plugged into your PBX.
Note: Trunk, Co, and land lines terms can be used interchangeably.
Top called widget lists all the numbers which your company or organization receive a lot of calls from.
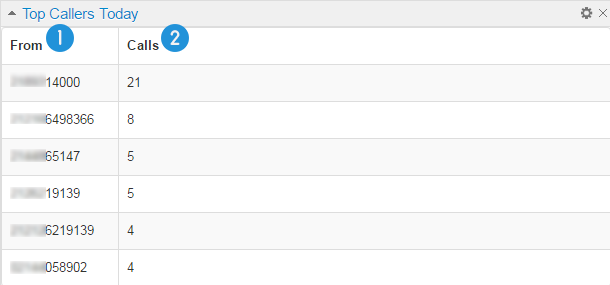
1. To: the phone number which called your organization or company
2. Calls: the number of received calls
This widget shows a list of all the phone numbers which were dialed by your company.
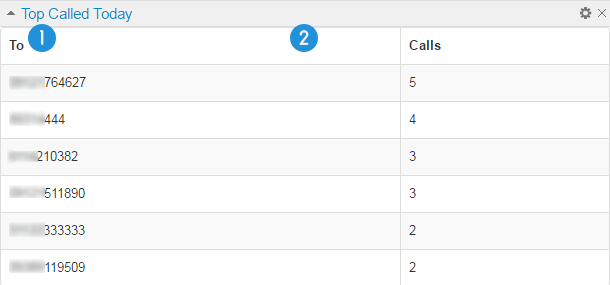
1. To: the phone number to which the call was made by your company
2. Calls: the number of calls
This widget shows a list all of the extensions which are used very often, both for Incoming, and Outgoing calls. It has three columns of Ext, Name, and Calls.
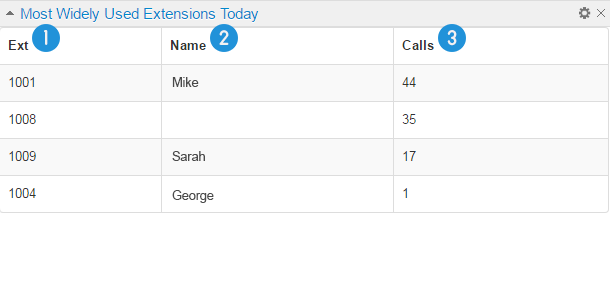
1. Ext: it shows the extension number
2. Name: name of the user
3. Calls: it shows the total number of both Incoming and Outgoing calls, recieved and made by a extension
This widget shows a list all of the extensions which are used very often for answering Incoming calls. It consists of three columns of Ext, Name, and Calls.
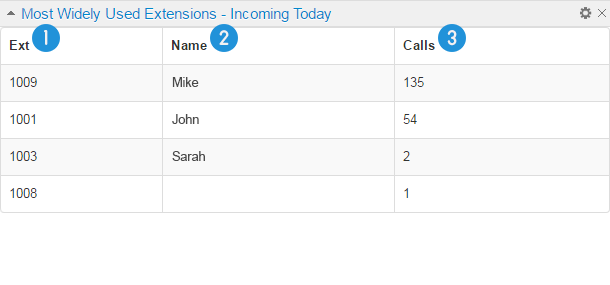
1. Ext: it shows the extension number
2. Name: name of the user
3. Calls: it shows the total number of Incoming calls recieved by a extension
This widget shows a list all of the extensions which are used very often for making Outgoing calls. It consists of three columns of Ext, Name, and Calls.
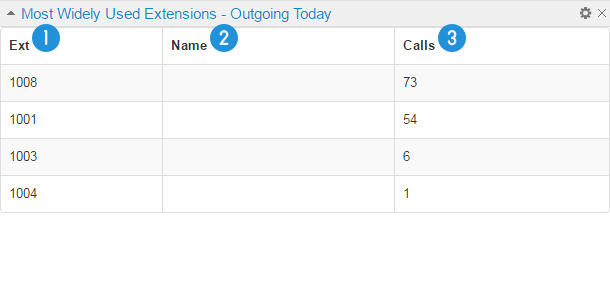
1. Ext: it shows the extension number
2. Name: name of the user
3. Calls: it shows the total number of Outgoing calls made by a extension
This widget lists a very recent Incoming calls which were Abandoned and not answered. Last Abandoned Calls widget has four columns of, DateTime, From, Ext, and Duration.
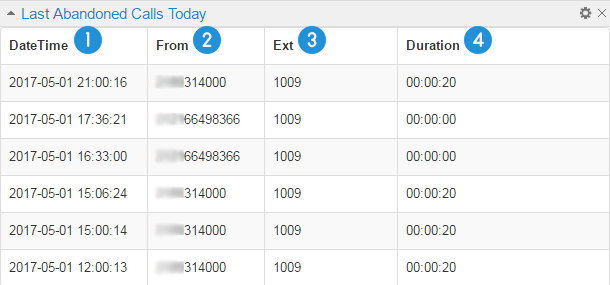
1. DateTime: it shows the exact date and time the call which was Abandoned
2. From: the phone number from which the call was received
3. Ext: the extension number which received the call
4. Duration: before hang-up time/ waiting time duration
A widget to list all the extensions that have the longest conversation durations. This widget has three columns of Ext, Calls, and Duration.
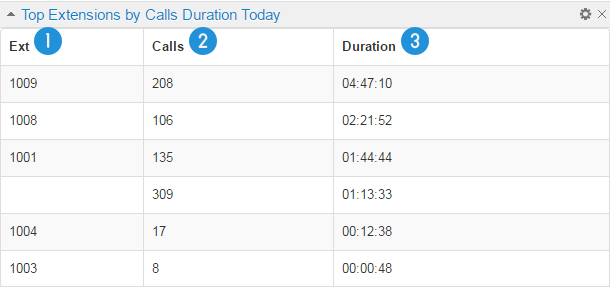
1. Ext: the extension number
2. Calls: number of Incoming and Outgoing calls by the extension
3. Duration: total duration of conversations of both Incoming and Outgoing calls
A widget to list all the extensions which have the longest conversations on Incoming calls. This widget has three columns of Ext, Calls, and Duration.
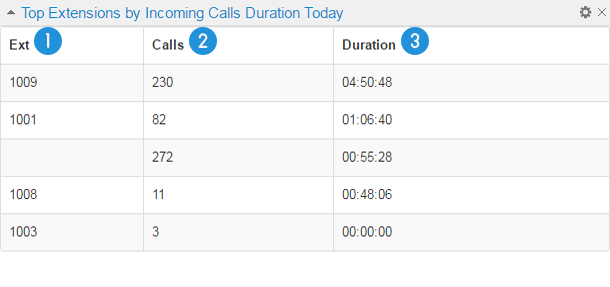
1. Ext: the extension number
2. Calls: number of Incoming calls received by the extension
3. Duration: total duration of conversations on Incoming calls
A widget to list all the extensions which have the longest conversations on Outgoing calls. This widget has three columns of Ext, Calls, and Duration.
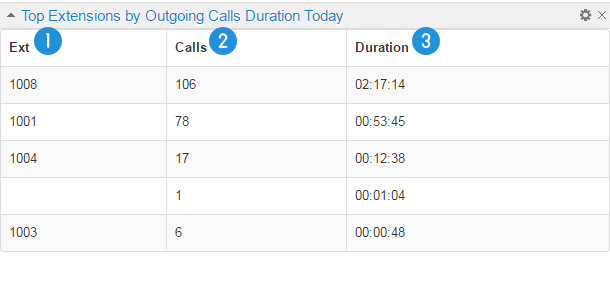
1. Ext: the extension number
2. Calls: number of Outgoing calls made by the extension
3. Duration: total duration of conversations on Outgoing calls
This widget shows a duration-based list of the longest both Incoming and Outgoing calls. It has five columns of DateTime, From, To, Ext, and Duration.
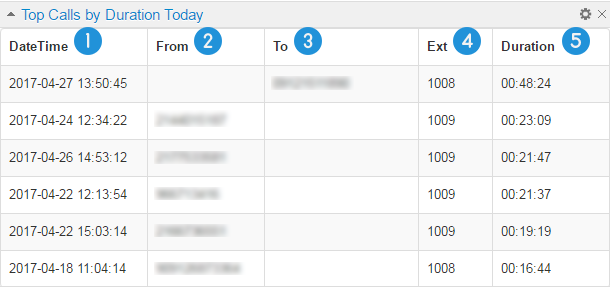
1. DateTime: the exact date and time of the call
2. From: the phone number of the caller
3. To: the dialed number
4. Ext: the extension number which answered or made the call
5. Duration: duration of either an Incoming or a Outgoing call
This widget shows a duration-based list of the longest Incoming calls. It has four columns of DateTime, From, Ext, and Duration.
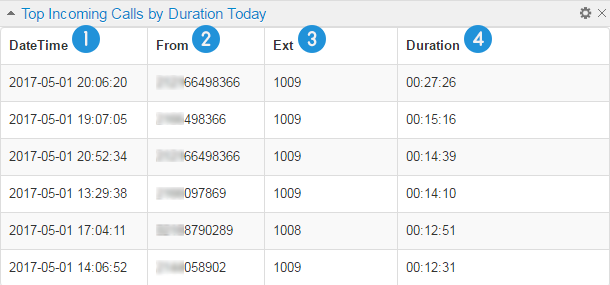
1. DateTime: the exact date and time of the call
2. From: the phone number of the caller
4. Ext: the extension number which received the call
5. Duration: duration of the call
This widget shows a duration-based list of the longest Outgoing calls. It has four columns of DateTime, To, Ext, and Duration.
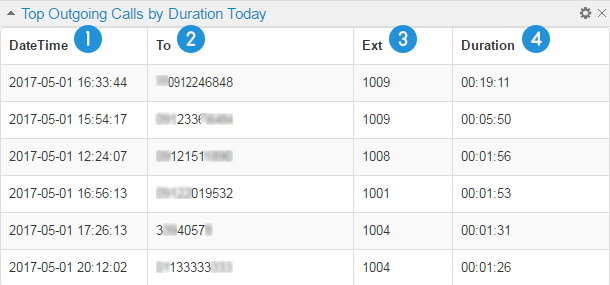
1. DateTime: the exact date and time of the call
2. To: the dialed number
4. Ext: the extension number which made the call
5. Duration: duration of the call
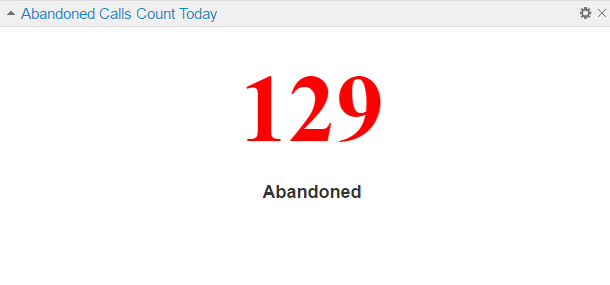
This widget displays the total number of Abandoned calls.
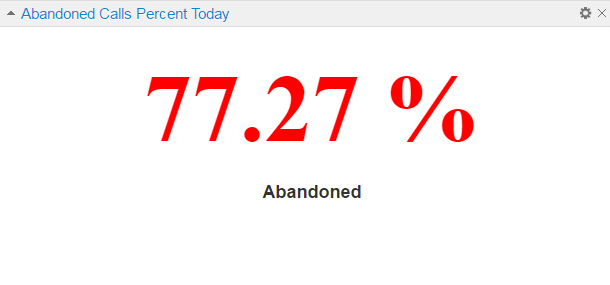
This widget displays total percentage of Abandoned calls.
This widget shows total number of Incoming calls.
This widget shows total percentage of Incoming calls.
This widget shows total number of Outgoing calls.
This widget displays total percentage of Outgoing calls.
This widget shows total number of Incoming, Outgoing, and Abandoned calls.
This widget shows total duration of Incoming calls.
This widget shows total duration of Outgoing calls.
This widget shows total duration of both Incoming and Outgoing calls.
Abandoned Calls Gauge widget shows total number of Abandoned calls using a gauge.
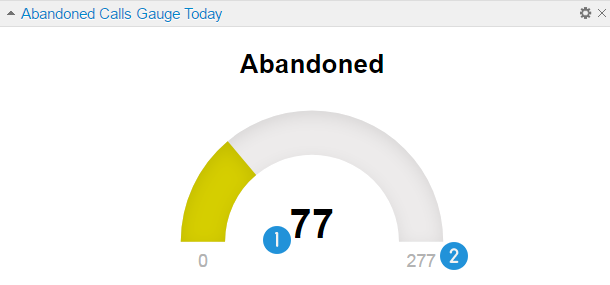
1. Total number of Abandoned calls
2. Total number of Incoming calls
This widget shows total number of Incoming calls using a gauge.
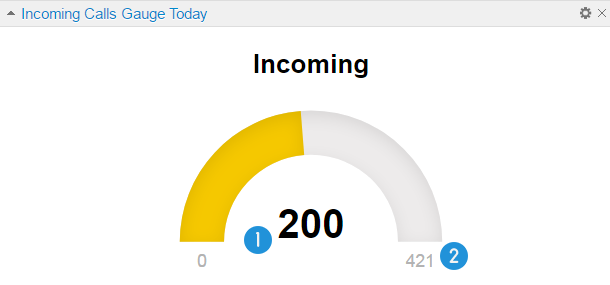
1. Total number of Incoming calls
2. Total number of Incoming, Abandoned, and Outgoing calls
This widget shows the total number of Outgoing calls using a gauge.
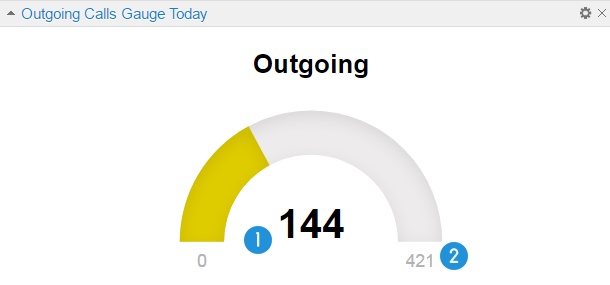
1. Total number of Outgoing calls
2. Total number of Incoming, Abandoned, and Outgoing calls
This widget displays the total cost of Incoming calls.
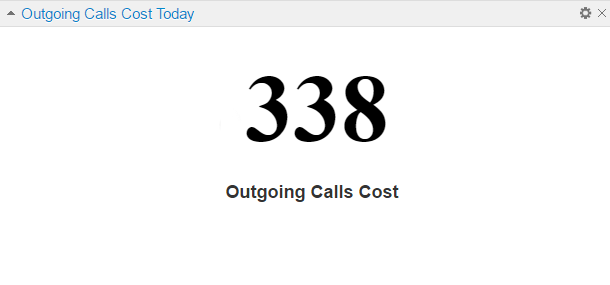
This widget displays the total cost of Outgoing calls.
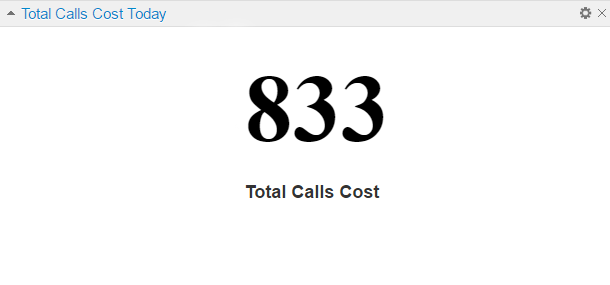
This widget displays the total cost of Incoming and Outgoing calls.
This widget shows a list of the most costly Incoming and Outgoing calls. It has six columns of DateTime, From, To, Ext, Duration, and Cost.
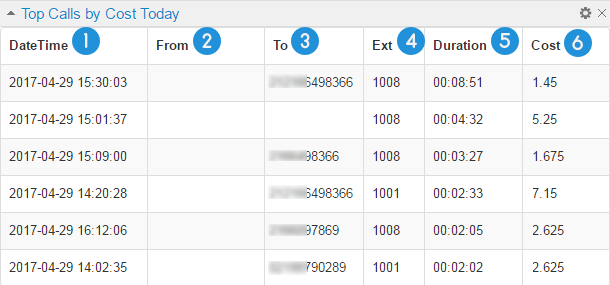
1. DateTime: the exact date and time of the call
2. From: the phone number of the caller
3. To: the dialed number
4. Ext: the extension number which answered or made the call
5. Duration: duration of the call
6. Cost: cost of the call
This widget shows a list of the most costly Incoming calls. It has five columns of DateTime, From, Ext, Duration, and Cost.
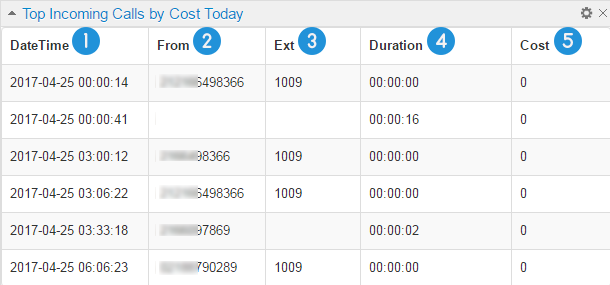
1. DateTime: the exact date and time of the call
2. From: the phone number of the caller
3. Ext: the extension number which received the call
4. Duration: duration of the call
5. Cost: cost of the call
This widget shows a list of the most costly Outgoing calls. It has five columns of DateTime, To, Ext, Duration, and Cost.
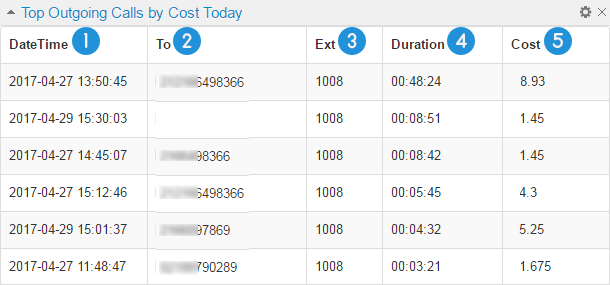
1. DateTime: the exact date and time of the call
2. To: the dialed number
3. Ext: the extension number which made the call
4. Duration: duration of the call
5. Cost: cost of the call
This widget lists the most costly extensions by showing the total number of their Incoming and Outgoing calls and their total cost. It consists of three columns of Ext, Calls, and Cost.
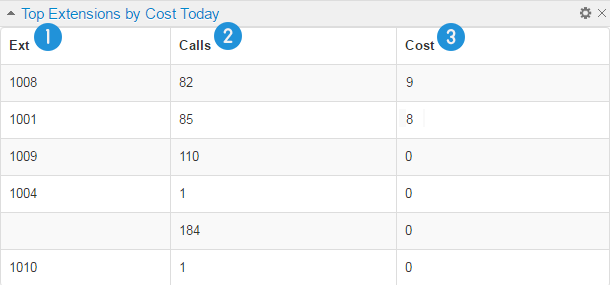
1. Ext: extension number
2. Calls: number of Incoming and Outgoing calls
3. Cost: the total cost of Incoming and Outgoing calls
This widget lists the most costly extensions by showing the total number of their Incoming calls, and their total cost. It has three columns of Ext, Calls, and Cost.
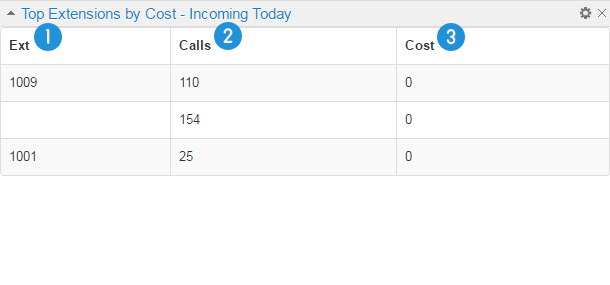
1. Ext: extension number
2. Calls: number of Incoming calls
3. Cost: the total cost of Incoming calls
This widget lists the most costly extensions by showing the total number of their Outgoing calls, and their total cost. It consists of three columns of Ext, Calls, and Cost.
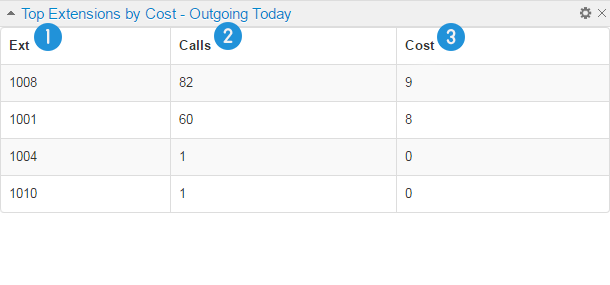
1. Ext: extension number
2. Calls: number of Outgoing calls
3. Cost: the total cost of Outgoing calls
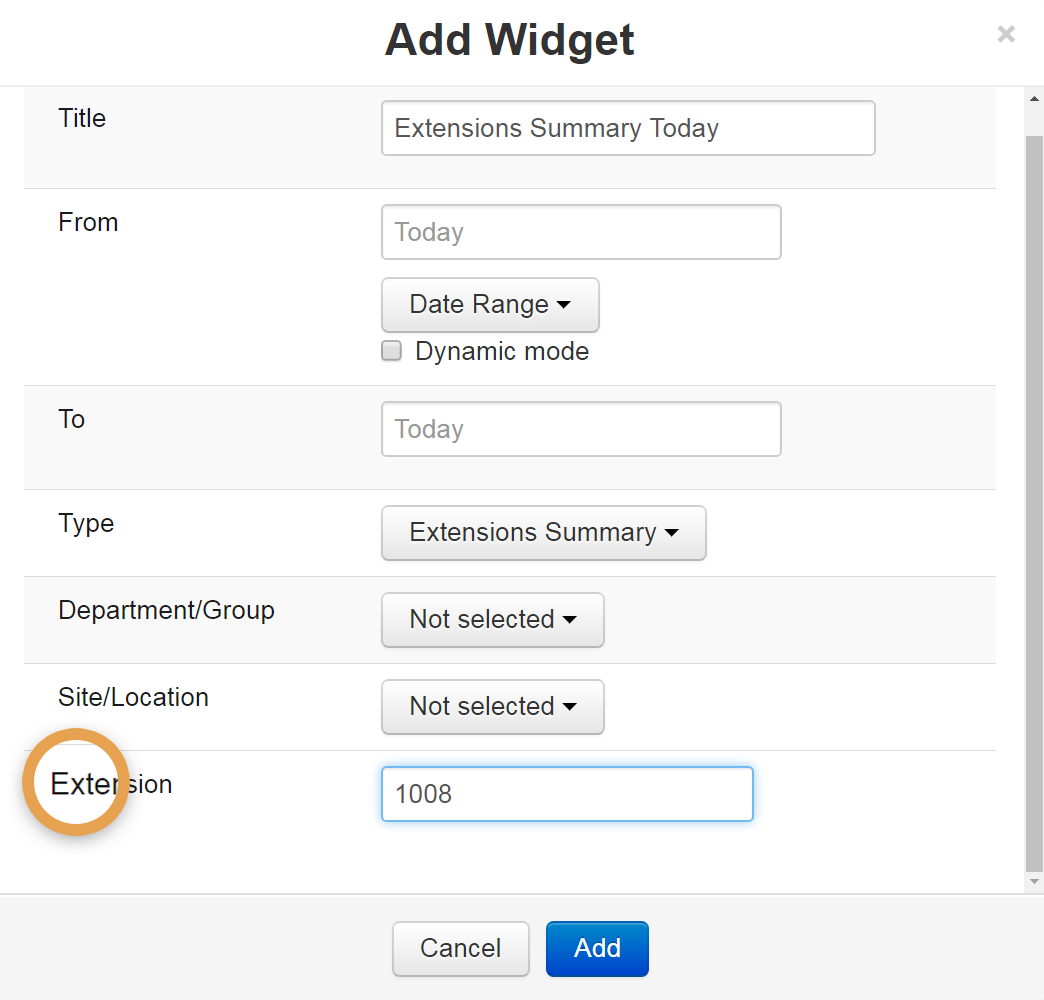
This widget shows a summary report of all the Incoming, Outgoing, Abandoned calls and even more, of a certain extension by first defining the extension number in the add widget dialog box.
1. Total: all the Incoming and Outgoing calls
2. Abandoned: all the missed calls
3. Incoming: all the calls received
4. Outgoing: all the calls made
5. Max Duration Incoming Call: shows the longest duration among the Incoming calls
6. Max Duration Outgoing Call: shows the longest duration of the Outgoing calls
7. First Call: the exact time and date the first call was made
8. Last Call: the exact time and date the last call was made
Note: when adding a Extentions Summary widget to the dashboard, you also need to define the extention number in the dialog box as shown below:
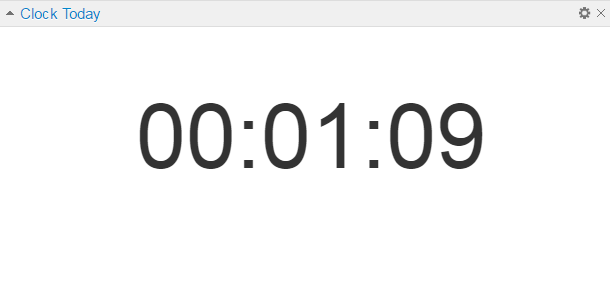
Clock widget displays the current time on your machine.
This widget presents the number of Incoming, Outgoing, and Abandoned calls on the daily basis using several continual linear graphs with colors blue, black, and green. Call Traffic widget has two axes.
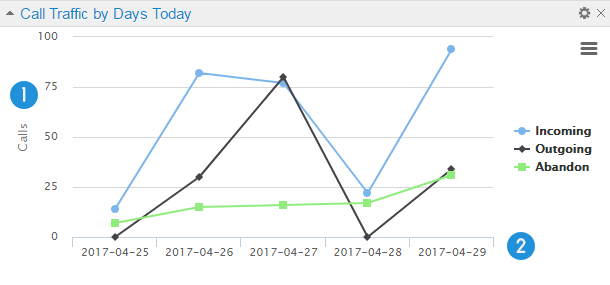
1. Vertical axis: number of the calls at a specific day can be defined on the vertical axis.
2. Horizontal axis: days are scattered across the horizontal axis
This widget shows the Average Handle Time (AHT) for all the Incoming and Outgoing calls.
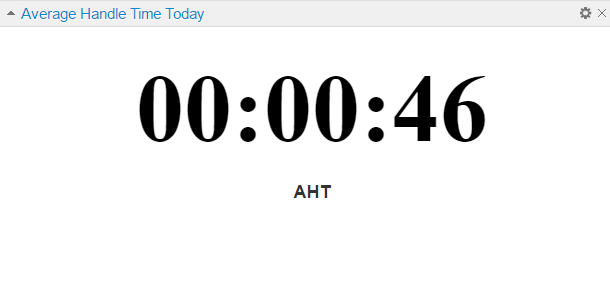
Note: AHT or Average Handle Time can be calculated by adding all the durations of Incoming, and Outgoing calls and dividing the result by the total number of them.
This widget shows the Average Handle Time for all the Incoming (AHTI) calls.
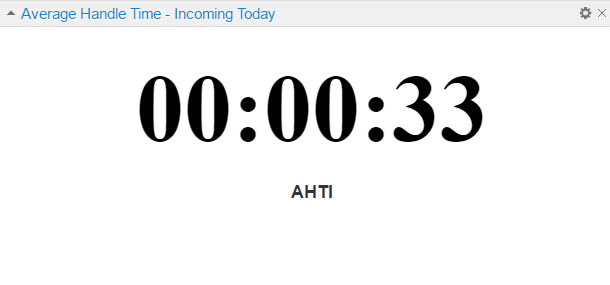
Note: AHTI or Average Handle Time Incoming can be calculated by adding all the durations of Incoming calls, and divding the result by the total number of the them.
This widget shows the Average Handle Time for all the Outgoing (AHTO) calls.
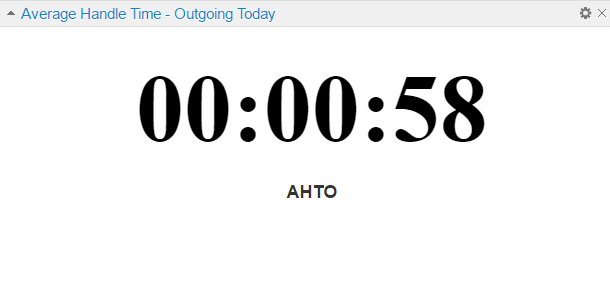
Note: AHTO or Average Handle Time Outgoing can be calculated by adding all the durations of Outgoing calls, and divding the result by the total number of them.
This widget shows the Average Handle Time (AHT) for all the Incoming and Outgoing calls by using a gauge.
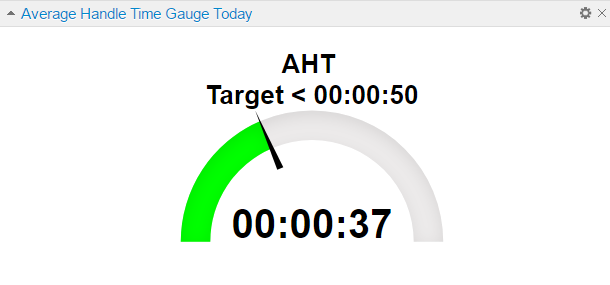
After clicking on Add Widget button on the horizontal bar. The add widget dialog window pops up on the screen, in which we can specify a Target time for Average Handle Time (AHT) gauge.
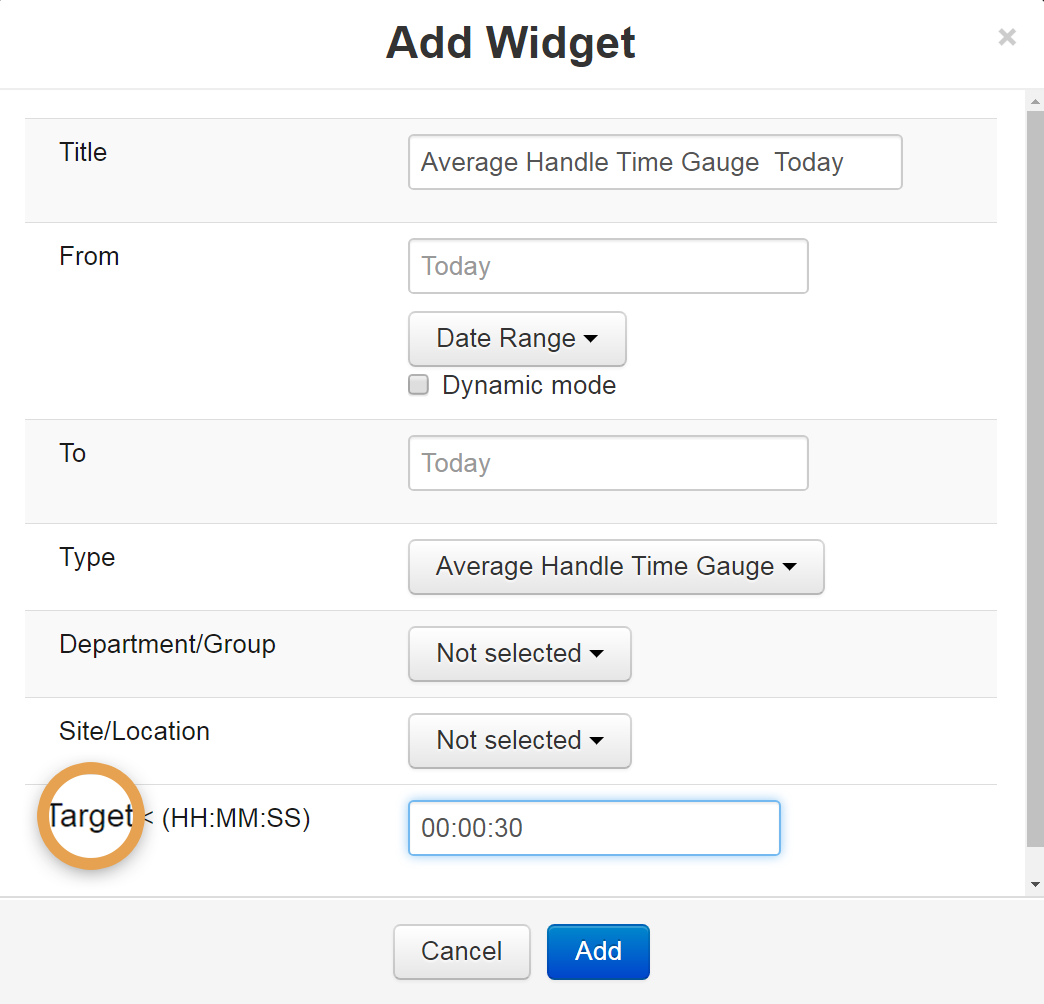
If the average handle time (AHT) of all the Incoming and Outgoing calls is less than the Target time we defined for the widget, then the gauge shows green. If the AHT value is greater than the Target time, then gauge turns red.
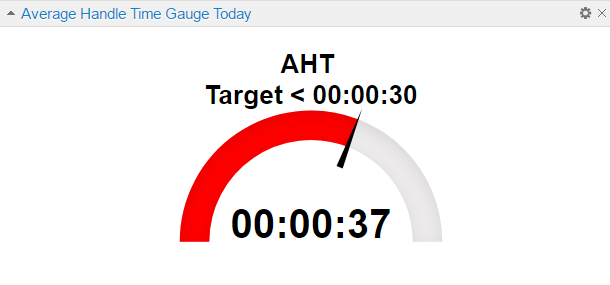
Note: AHT or Average Handle Time can be calculated by adding all the durations of Incoming and Outgoing calls, and divding the result by the total number of the calls.
This widget shows the Average Handle Time Gauge – Incoming (AHTI) for all the Incoming calls by using a gauge.
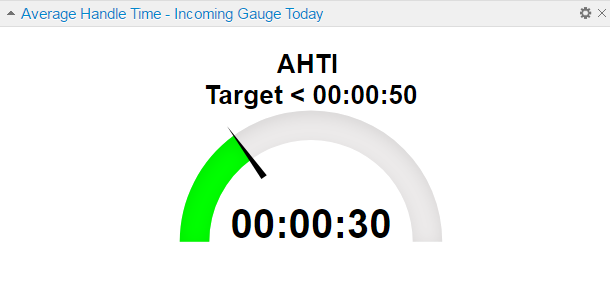
After clicking on Add Widget button on the horizontal bar. The add Widget dialog window pops up on the screen, in which we can specify a Target time for Average Handle Time for Incoming (AHTI) calls.
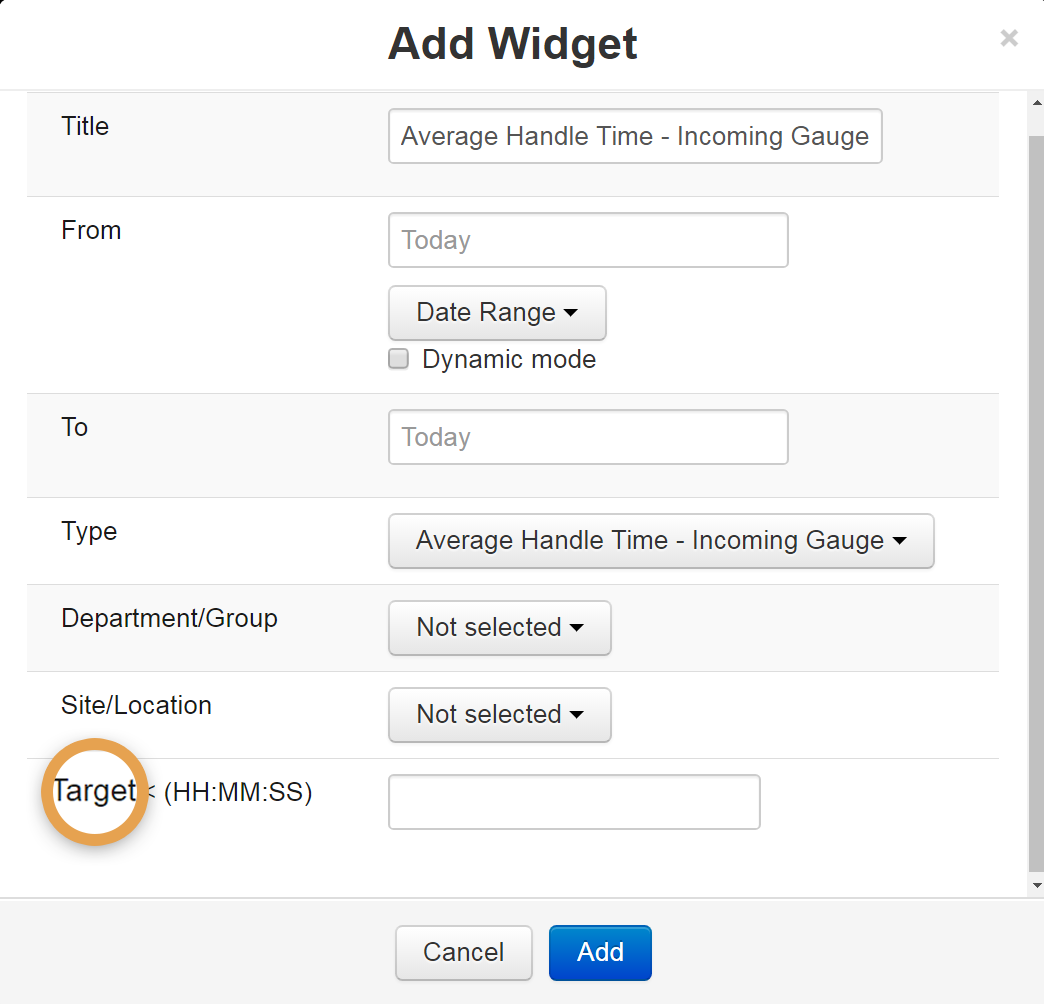
If the average handle time of all the Incoming calls is less than the Target time we defined for the widget, then the gauge shows green. If the AHTI value is greater than the Target time, then gauge turns red.
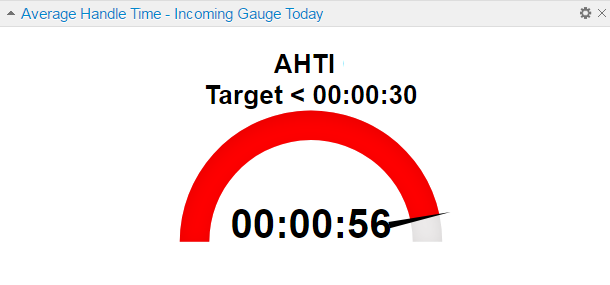
Note: AHTI or Average Handle Time for Incoming calls can be calculated by adding all the durations of the Incoming calls, and divding the result by the total number of them.
This widget shows the Average Handle Time Gauge – Outgoing (AHTO) for Outgoing calls by using a gauge.
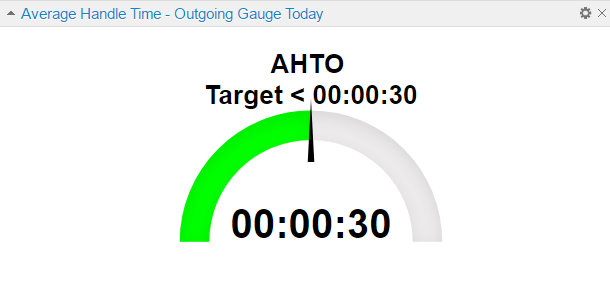
After clicking on Add Widget button on the horizontal bar. The add Widget dialog window pops up on the screen, in which we can specify a Target time for Average Handle Time for Outgoing (AHTO) calls.
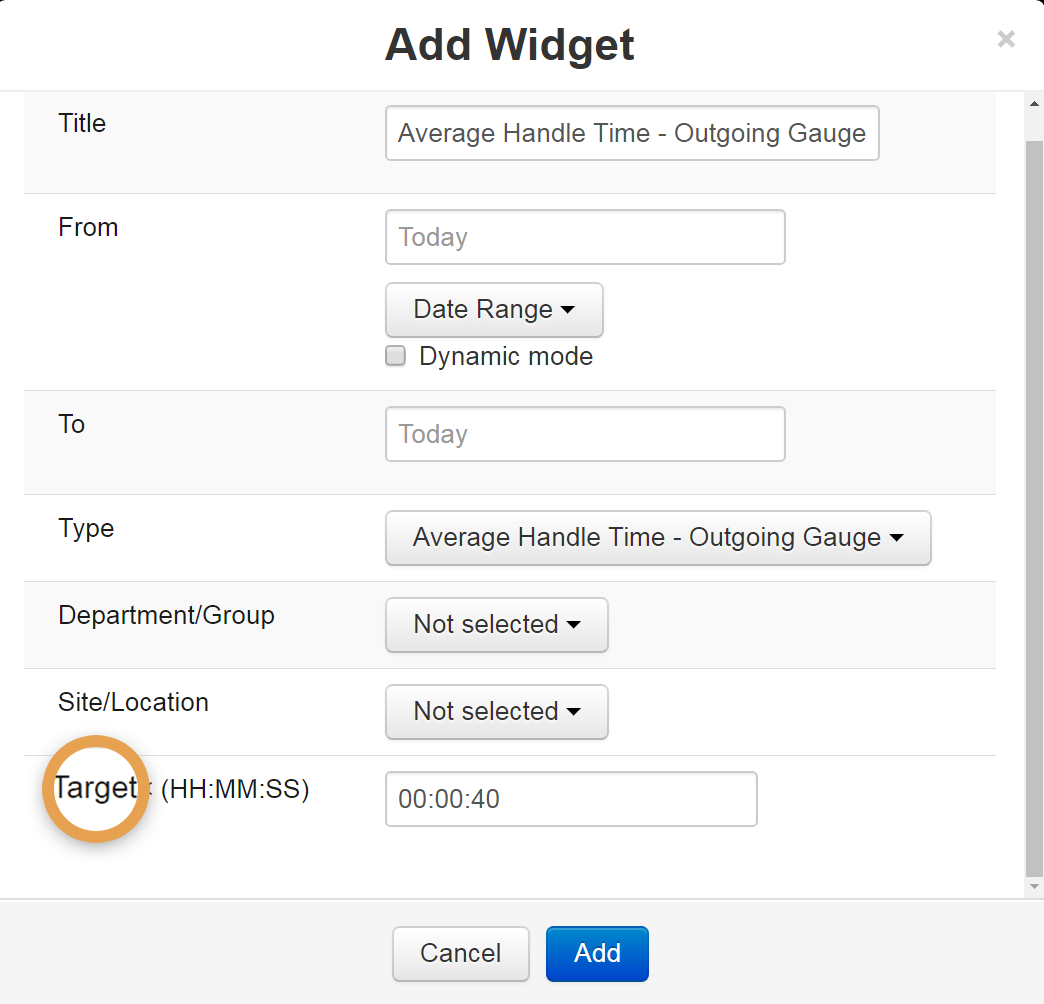
If the average handle time of all the Outgoing calls is less than the Target time we defined for the widget, then the gauge shows green. If the AHTO value is greater than the Target time, then gauge turns red.
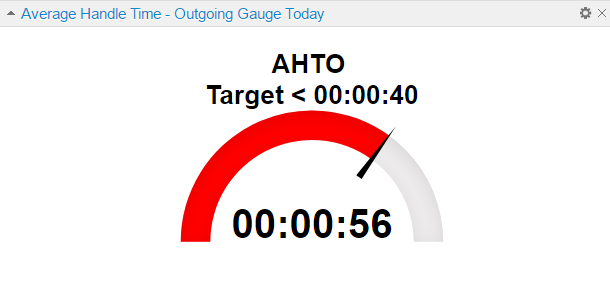
Note: AHTO or Average Handle Time for Outgoing calls can be calculated by adding all the durations of the Outgoing calls, and divding the result by the total number of them.
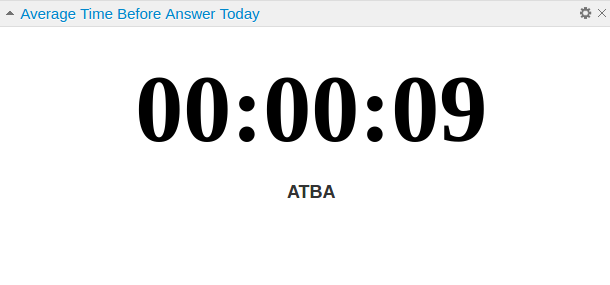
Average Time Before Answer (ATBA) widget displays the average of waiting time before an extension answers the call. In other words, the Time Before Answer is the duration the phone starts ringing to when it’s answered by a someone.
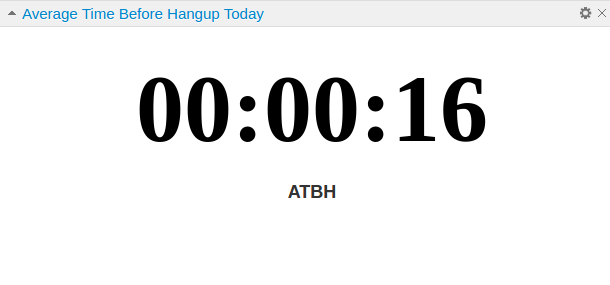
Average Time Before Hang up (ATBH) widget displays average of waiting time of all incoming calls before they are abandoned. In other words, the Time Before Answer is the duration when the phone starts ringing to the exact moment the caller hangs up the phone.
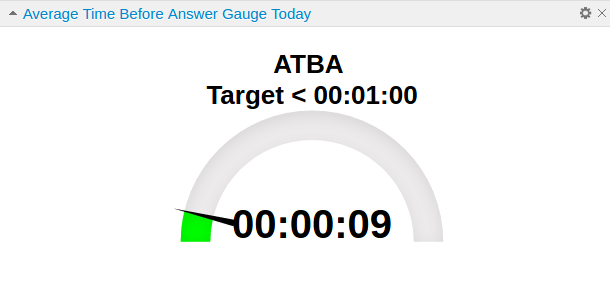
Average Time Before Answer Gauge widget, or ATBA displays the average of waiting time before an extension answers the call by using a gauge. In other words, the Time Before Answer is the duration when the phone starts ringing to when it’s answered by a someone.
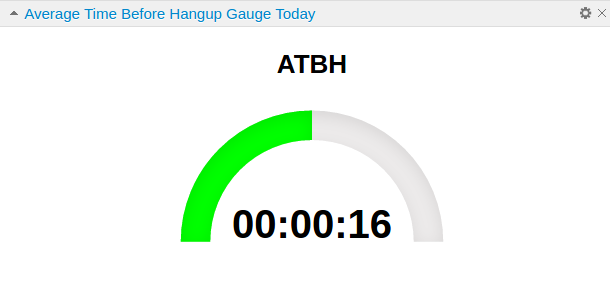
Average Time Before Hang up Gauge widget, or ATBH displays the average of waiting time of all incoming calls before they are abandoned. In other words, the Time Before Answer is the duration when the phone starts ringing to the exact moment the caller hangs up the phone.
By using Real-Time Extension Status widget, we can list up to 9 different extensions and monitor their status and see if they are idle, ringing, calling, or even busy talking. The extension gets colored differently for each different status.
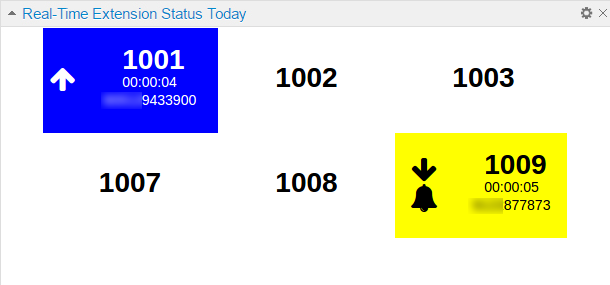
1. When the extention is idle, it shows white.
2. Whenever an extension receives a call, it turns yellow, and a down-point arrow appears beside it. Also, the phone number of the caller is shown along with the waiting time before the call gets answered.
3. When an extension answers a received call, it changes from yellow to blue color. The caller number is displayed along with the real-time duration of the conversation.
4. When an extension makes a call, it turns blue with a up-point arrow. The dialed number is shown along with the waiting time before the call gets answered.
Note: Make sure that both your PBX and PBXDom support real-time protocol feature.
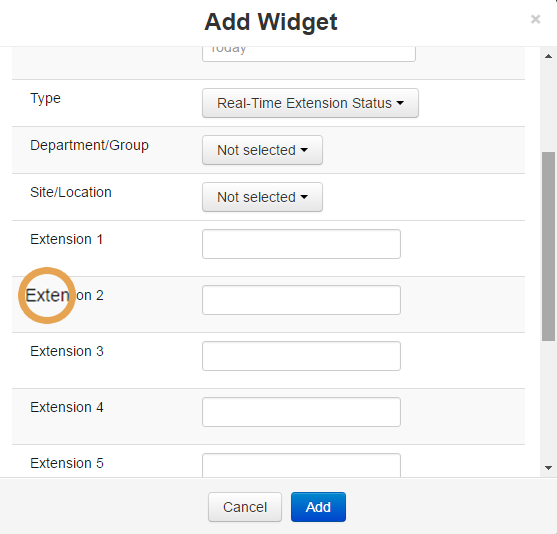
You can specify as many as nine extensions while adding this widget to your dashboard.
This real-time widget shows the land lines status, to see if they are idle, or not.
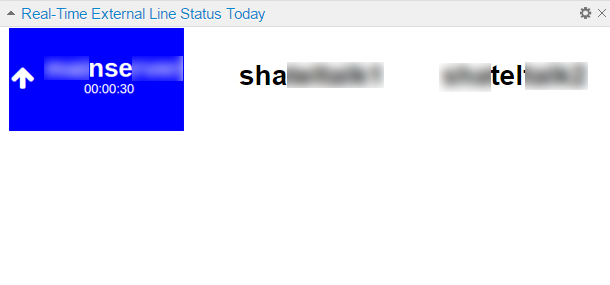
1. When a land line is idle, it shows white.
2. Whenever a land line receives a call, it turns yellow, and a down-point arrow appears beside it. Also, the phone number of the caller is shown along with the waiting time before the call gets answered. However, for the digital land lines, this switch of colors happens so rapidly that it can’t be noticed.
3. When a land line makes a call, it turns blue with a up-point arrow. The waiting time is also shown before the call gets answered.
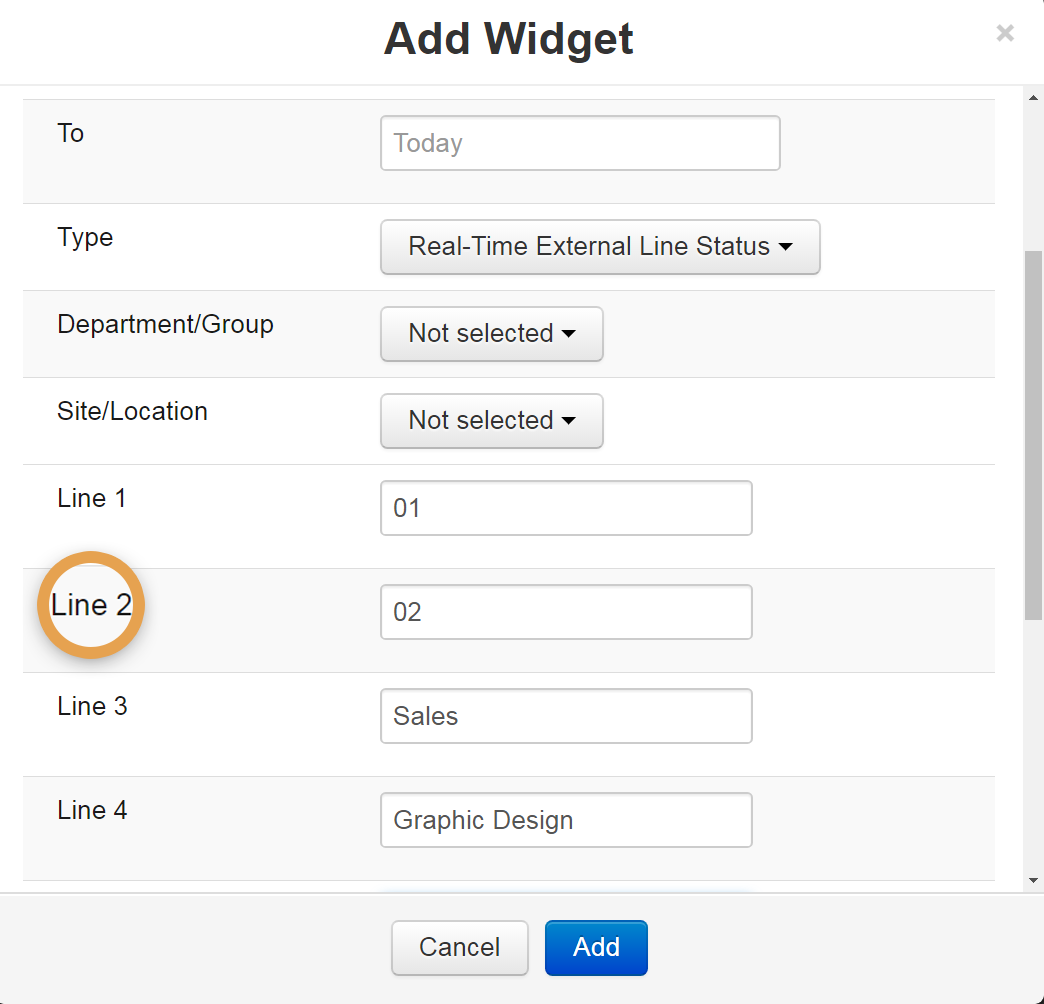
You can specify as many as nine land lines while adding this widget to your dashboard.
Note: Make sure that both your PBX and PBXDom support real-time protocol.
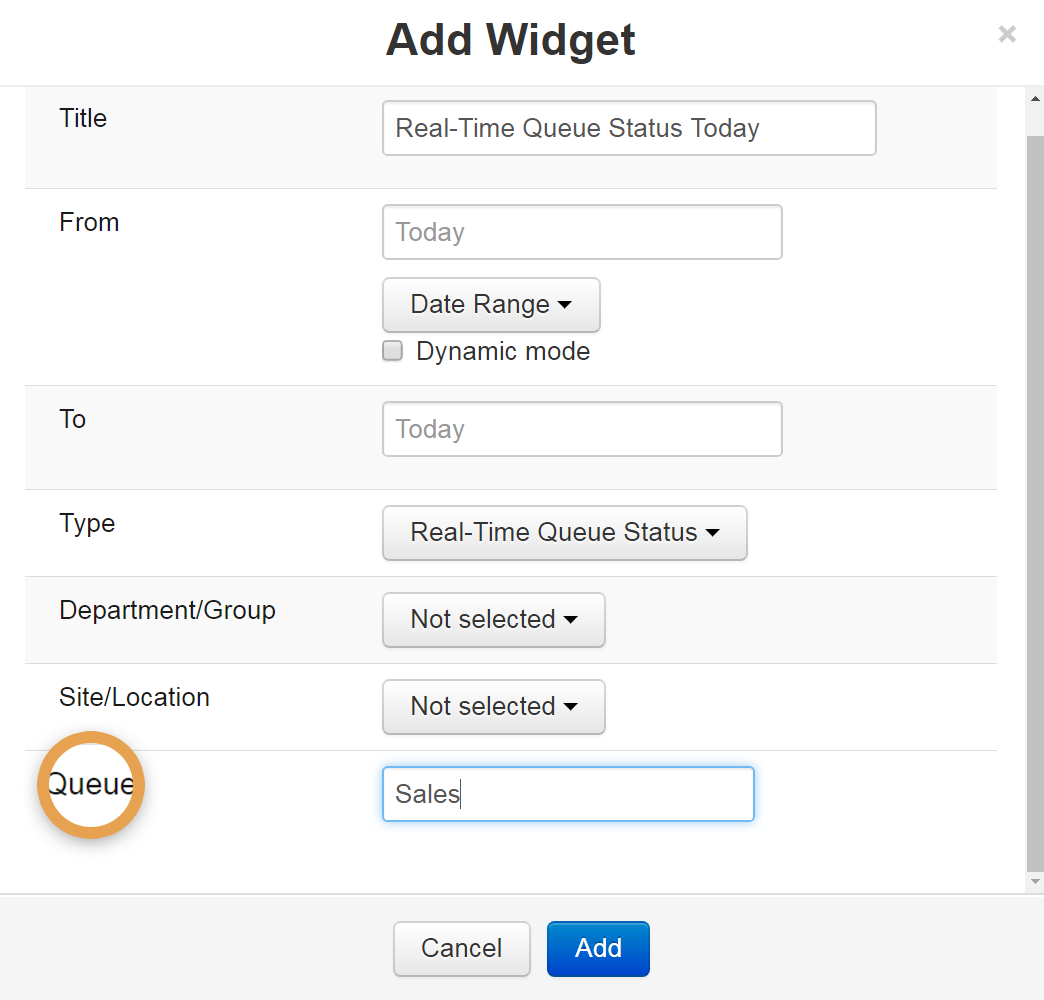
This real-time widget shows as many as 8 Incoming calls waiting on the queue list to be answered.
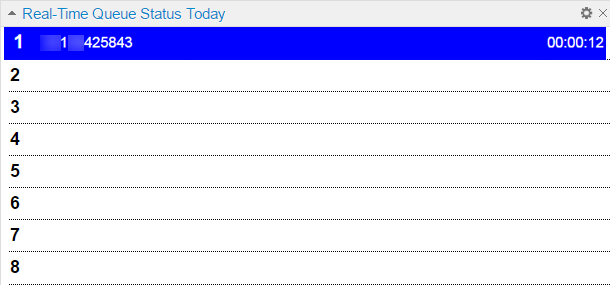
You can specify a name or number for your queue list of waiting for incoming calls while adding the widget to the dashboard.
Note: Make sure that both your PBX and PBXDom support real-time protocol.
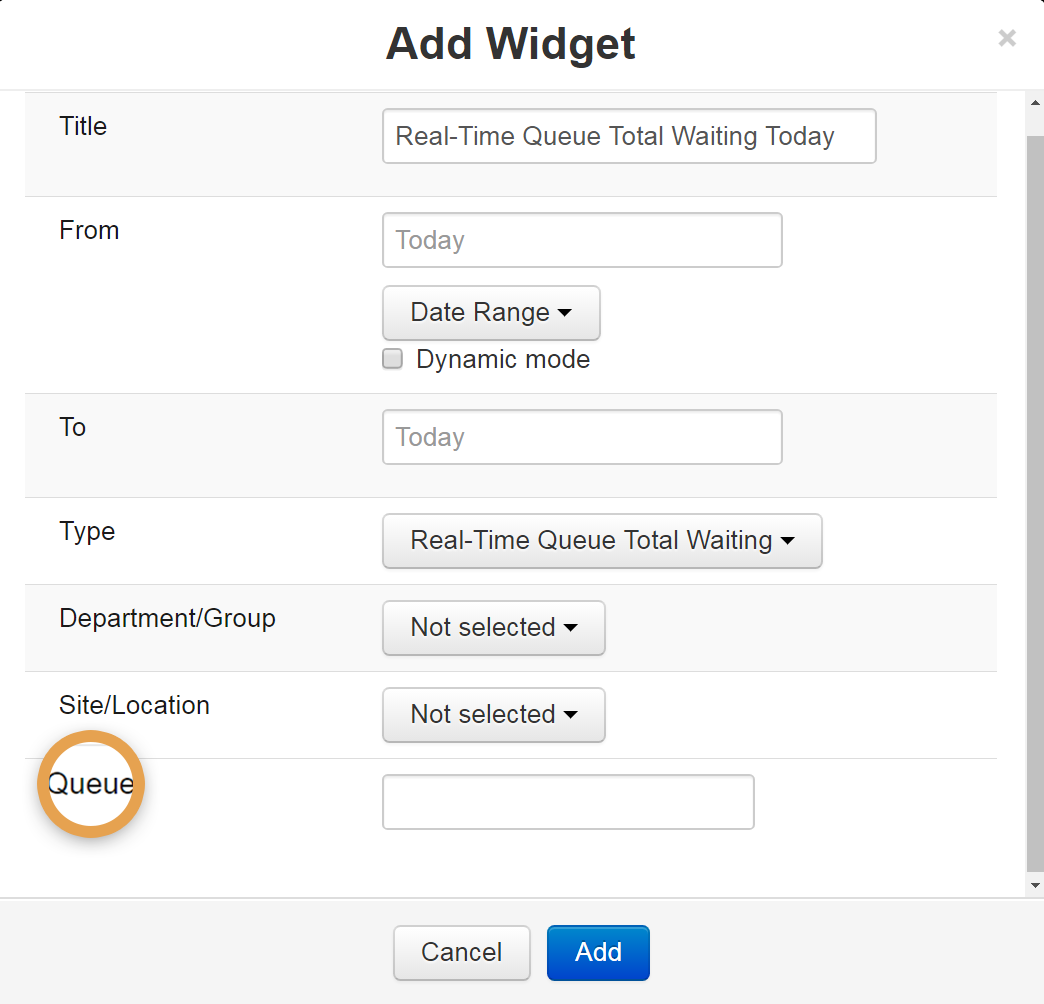
This real-time widget gives us the total number of Incoming calls waiting on the queue list to be answered.
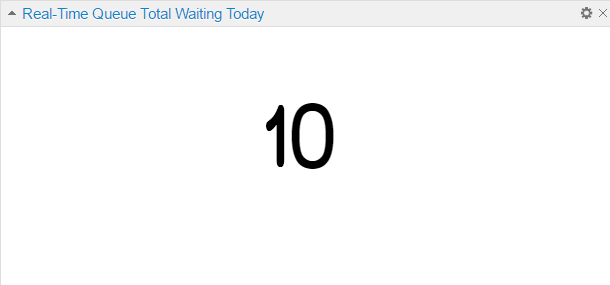
You can specify a name or number of a queue to view the number of waiting for incoming calls while adding the widget to the dashboard.
Note: Make sure that both your PBX and PBXDom support real-time protocol.
This widget shows all the concurrent calls based on the seconds.
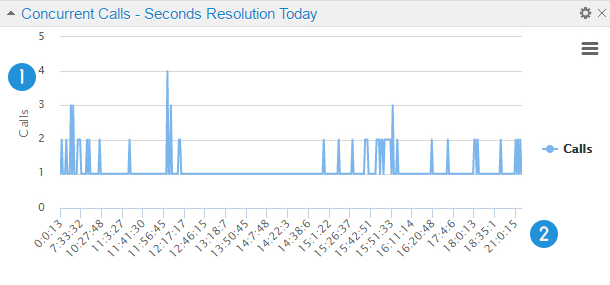
1. Calls: the number of concurrent calls
2. Timeline(s): Time based on seconds
Tip: this widget helps managers to learn about and evaluate their land lines needs, and decide better if it is necessary to increase up the number of them or not.
This widget shows all the concurrent calls based on the minutes.
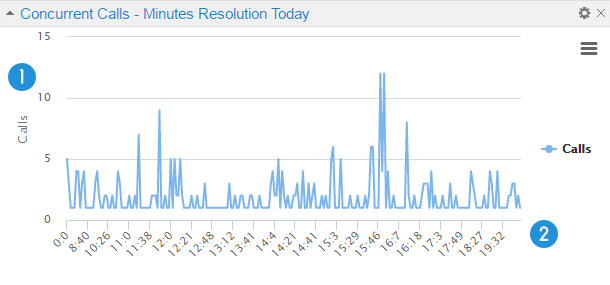
1. Calls: the number of concurrent calls
2. Timeline(m): time based on minutes
Tip: this widget helps managers to learn about and evaluate their land lines needs, and decide better if it is necessary to increase up the number of them or not.
This widget shows all the concurrent calls based on the hours.
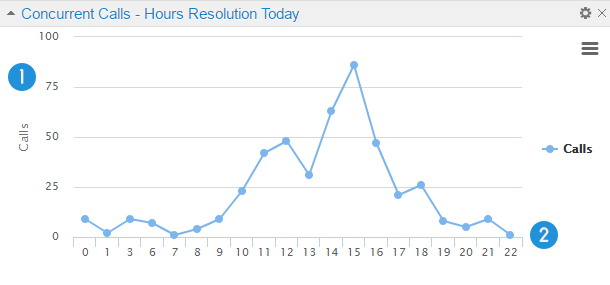
1. Calls: the number of concurrent calls
2. Timeline(h): time based on hours
Tip: this widget helps managers to learn about and evaluate their land lines needs, and decide better if it is necessary to increase up the number of them or not.
This widget shows you the calls made between the extensions in a company or organization within a specified range of time.
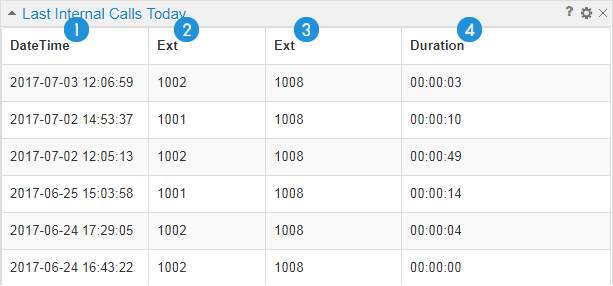
1. DateTime: the exact date and time the call was made
1. Ext: the extension which made the call
1. Ext: the extension which received the call
1. Duration: duration of the call
Collector status widget shows you the status of Collector software installed for each of the PBXes for determining whether or not they’re working properly. This widget also shows you whether or not the Collector software needs to get updated.
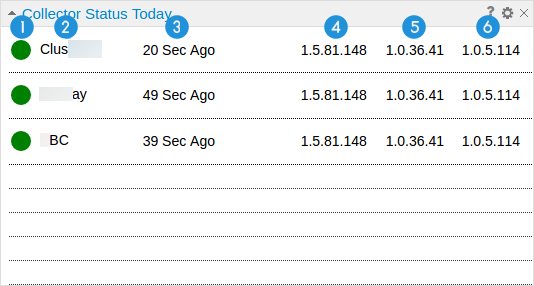
1. Indicates the status of a Collector software, and whether or not it’s properly connected to the PBXDom cloud.
If the indicator is green, then it means that the Collector software is properly connected and the status is OK. If it shows red, it means that the Collector has some connection problems.
2. Name of the Collector software
3. Shows the last time of connection between Collector software and PBXDom cloud.
4. The current version of the Collector service
If the number shows black when you hover the mouse over it, the tooltip says that the Collector service uptodate. If it shows red, then this means that the Collector service is out of date and needs to get updated. By hovering the mouse over it, it says the Collector Service is out of date and needs to get updated.
Note: if the Collecter service version is red, and it is not the most recent version, then it’s acceptable not to update it for only a few days. But if this delay exceeds to more days, there will be some problems in automatic updating functionality. Hence, the Collector never gets updated. For this, we encourage you to contact the PBXDom via E-mail and online chatting, so that we could help you resolve the problem.
5. The current version of Collector software settings.
If the number shows black when you hover the mouse over it, the tooltip says that the Collector software setting is up-to-date. If it shows red, then this means that it is an old version and needs to get updated.
6. Shows the Agent service version, which is in charge of updating Collector software.
If the number shows black when you hover the mouse over it, the tooltip says that the Agent service is up-to-date. If it shows red, then this means that it is an old version and needs to get updated.
After clicking on the Add Widget button to add the Collector Status widget to a dashboard, the Add Widget dialog box appears. For Index field, enter a number starting from 0. To better understand it, pay attention to the example below.
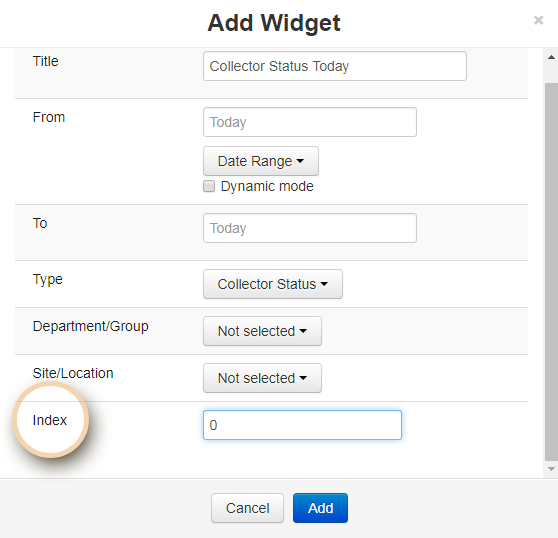
Example: assuming that we have 16 Collector softwares installed, and they are all sending data to PBXDom. In order to show the status of all of them, we have to present them in two separate Collector software widgets.
For the Index value of the first widget, we enter 0 to show only 8 Collector items.
To display the other remaining Collector softwares, we need another Collector Status widget with an Index value of 8.
If we had 24 Collector softwares connected to PBXDom, then we would place 3 Collector Status widgets to present them. Each Collector Status widget can only display 8 Collector items.
This widget shows you information from the status of PBXes and determines whether or not they are working properly. You can also find more information like PBX IDs, Names, Models, and the last time of the communication between PBXes and Collector software.
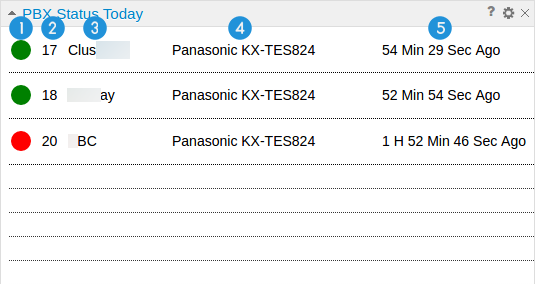
1. Indicates the status of a PBX, and whether or not it’s properly connected to the PBXDom cloud.
If the indicator is green, then it means that the PBX is properly connected and the status is OK. If it shows red, it means that the PBX machine has some connection problems.
2. Unique PBX ID on PBXDom
3. PBX name on PBXDom
4. PBX model type
5. Shows the last time of communication between the PBX and Collector software.
After clicking on the Add Widget button to add a PBX Status widget to a dashboard, the Add Widget dialog box appears. For Index field, enter a number starting from 0. To better understand it, pay attention to the example below.
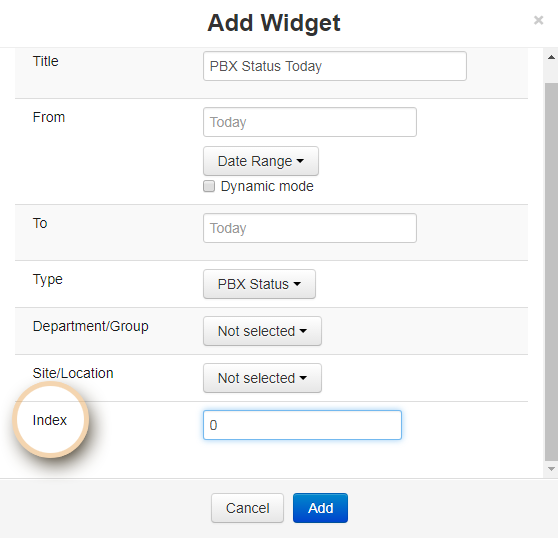
Example: assuming that we have 16 PBXes, and they are all sending data to PBXDom. In order to show the status of all of them, we have to present them in two separate PBX Status widgets.
For the Index value of the first widget, we enter 0 to show only 8 PBXes.
To display the other remaining PBXes items, we need another PBX Status widget with an Index value of 8.
If we had 24 PBXes connected to PBXDom, then we would place 3 PBX Status widgets to present them. Each PBX Status widget can only display 8 PBX items.
This widget can be used to show a simple text message on a dashboard for notification and even alerting purposes. This message can be shared with others when sharing a dashboard.
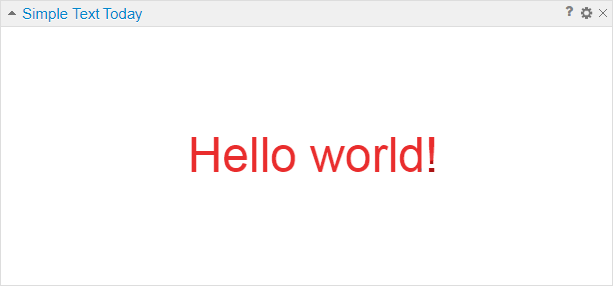
When trying to add Simple Text widget on a dashboard, in the Add Widget window, you need to enter your text to be displayed and define the colors.
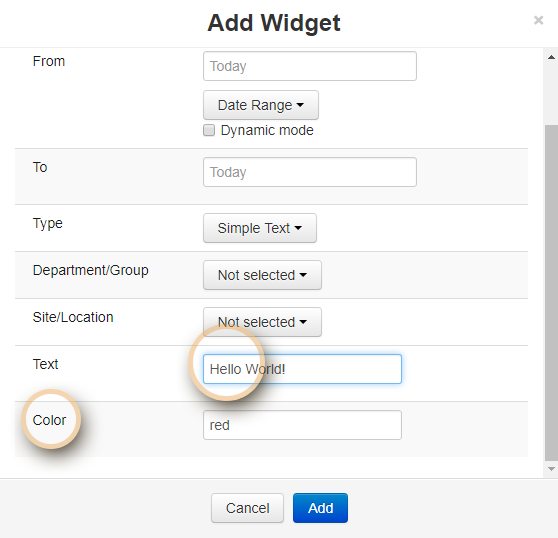
Note: The acceptable color values can be:
a. Color name: Blue, Red, Yellow, …
b. 6-digit hexadecimal: #455667
c. 3-digit hexadecimal: #103
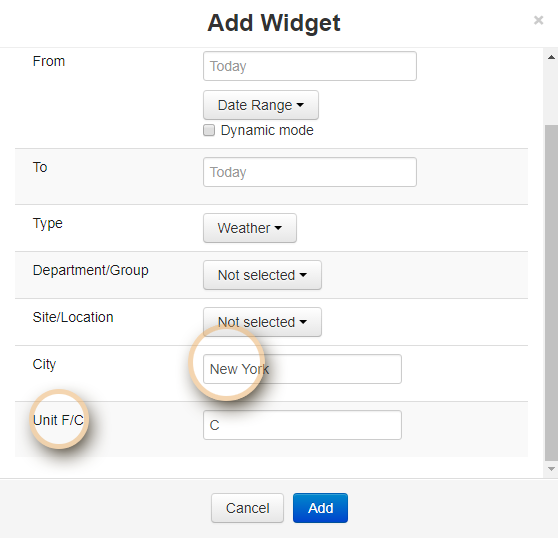
This widget can be used to show the weather condition of a city. All it takes is just entering your city name.
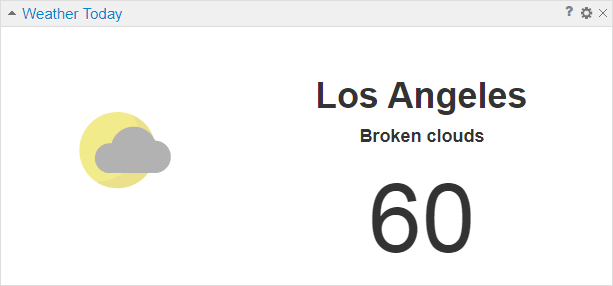
When trying to add Weather widget on a dashboard, in the Add Widget window, you need to specify your desired city. You can also specify the weather measurement unit by entering either F for Fahrenheit or C for Celsius.
This widget helps you evaluate your company or department total answering level.
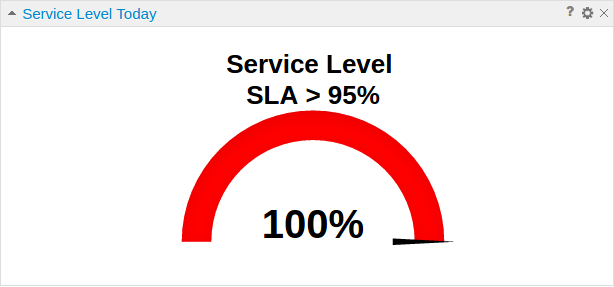
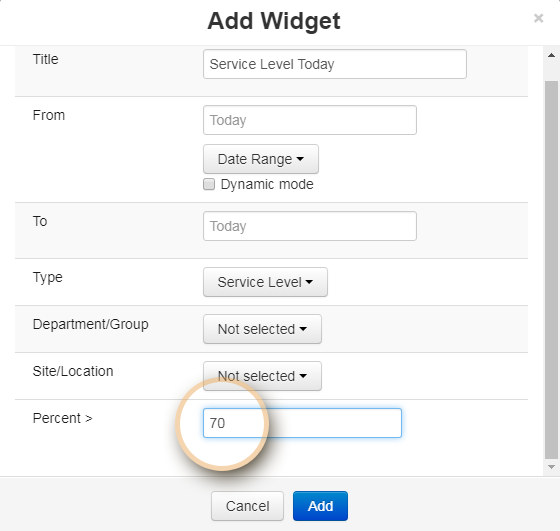
When trying to add Service Level widget on your dashboard, in the Add Widget pop-up window, you also need to specify your SLA percentage value.
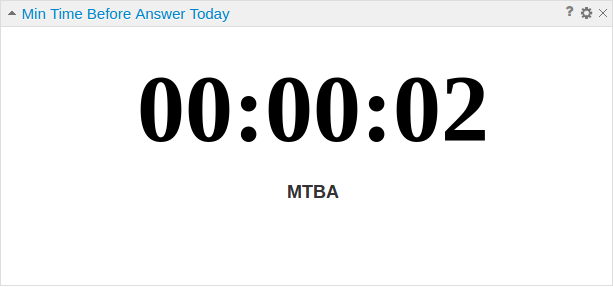
This widget shows the minimum waiting time when your clients call you. After learning about this value, layouting a plan for answering the calls can become possible.
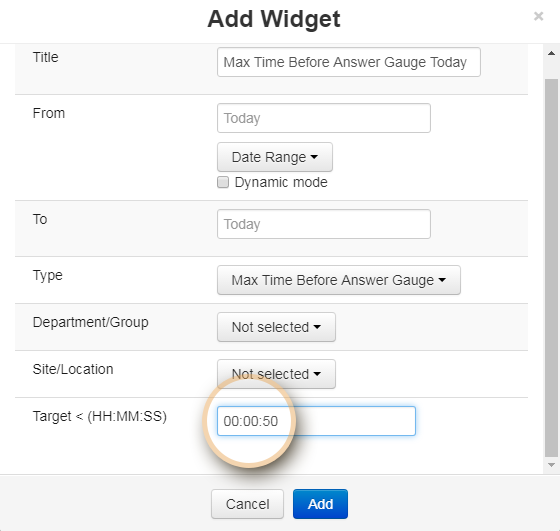
By adding this widget, managers of companies or organizations can set the maximum acceptable target waiting time before the call is answered. This widget helps you understand and evaluate the effectiveness of your efforts and plans.
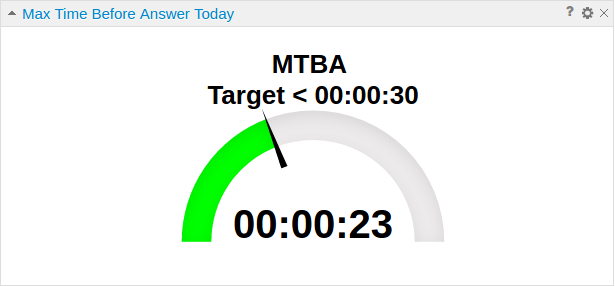
When trying to add an instance of Max Time Before Answer Gauge widget on your dashboard, in the Add Widget pop-up window, you need to insert your target waiting time (MTBA) in the specified format.